\n
## Box Plots: Angular Distance Comparison
### Overview
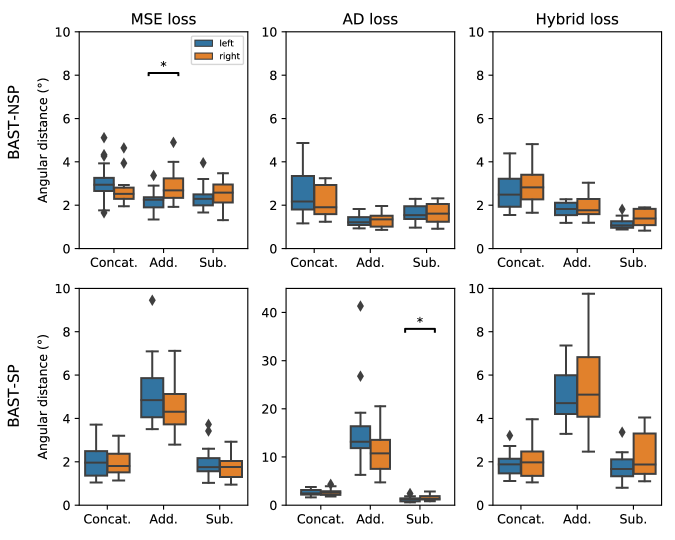
The image presents six box plots arranged in a 2x3 grid, comparing angular distances (in degrees) between "left" and "right" conditions under different loss functions (MSE, AD, Hybrid) and input methods (Concat., Add., Sub.). The y-axis represents "Angular distance (°)", ranging from 0 to 10. The x-axis represents the input method: "Concat.", "Add.", and "Sub.". Each plot also includes individual data points represented as black diamonds. Statistical significance is indicated by asterisks above certain plot pairs. The plots are labeled with "BAST-NSP" in the top row and "BAST-SP" in the bottom row.
### Components/Axes
* **Y-axis Label:** "Angular distance (°)" (present in all six plots)
* **X-axis Label:** Input method: "Concat.", "Add.", "Sub." (present in all six plots)
* **Loss Function Titles:** "MSE loss" (top-left), "AD loss" (top-center), "Hybrid loss" (top-right),
* **BAST Type Labels:** "BAST-NSP" (top row), "BAST-SP" (bottom row)
* **Legend:** Located in the top-left plot, with "left" represented by a blue color and "right" represented by an orange color.
* **Statistical Significance:** Asterisks (*) indicate statistically significant differences between "left" and "right" conditions.
### Detailed Analysis or Content Details
**Top Row (BAST-NSP)**
* **MSE Loss:**
* "left" (blue): Median ≈ 2.2°, IQR ≈ 1.8° to 3.5°, Min ≈ 0.8°, Max ≈ 4.5°
* "right" (orange): Median ≈ 2.8°, IQR ≈ 2.0° to 3.8°, Min ≈ 1.0°, Max ≈ 5.0°
* Asterisk above the "Concat." condition indicates statistical significance.
* **AD Loss:**
* "left" (blue): Median ≈ 1.8°, IQR ≈ 1.5° to 2.5°, Min ≈ 0.5°, Max ≈ 3.5°
* "right" (orange): Median ≈ 2.0°, IQR ≈ 1.5° to 3.0°, Min ≈ 0.5°, Max ≈ 4.0°
* **Hybrid Loss:**
* "left" (blue): Median ≈ 2.2°, IQR ≈ 1.8° to 3.0°, Min ≈ 0.8°, Max ≈ 4.0°
* "right" (orange): Median ≈ 2.8°, IQR ≈ 2.0° to 4.0°, Min ≈ 1.0°, Max ≈ 5.5°
**Bottom Row (BAST-SP)**
* **MSE Loss:**
* "left" (blue): Median ≈ 2.0°, IQR ≈ 1.5° to 2.8°, Min ≈ 0.5°, Max ≈ 4.0°
* "right" (orange): Median ≈ 2.4°, IQR ≈ 1.8° to 3.5°, Min ≈ 0.8°, Max ≈ 5.0°
* **AD Loss:**
* "left" (blue): Median ≈ 2.0°, IQR ≈ 1.0° to 3.0°, Min ≈ 0.5°, Max ≈ 4.0°
* "right" (orange): Median ≈ 12.0°, IQR ≈ 8.0° to 20.0°, Min ≈ 2.0°, Max ≈ 35.0°
* Asterisk above the "Sub." condition indicates statistical significance.
* **Hybrid Loss:**
* "left" (blue): Median ≈ 2.4°, IQR ≈ 1.8° to 3.5°, Min ≈ 0.8°, Max ≈ 5.0°
* "right" (orange): Median ≈ 4.0°, IQR ≈ 2.5° to 6.0°, Min ≈ 1.0°, Max ≈ 8.0°
### Key Observations
* For BAST-NSP, the "left" and "right" conditions generally have similar angular distances across all loss functions and input methods, except for the "Concat." condition under MSE loss, where a statistically significant difference is observed.
* For BAST-SP, the "right" condition consistently exhibits higher angular distances than the "left" condition, particularly under the AD loss function. The "Sub." condition under AD loss shows a very large difference and is statistically significant.
* The AD loss function generally results in larger angular distances for BAST-SP compared to the other loss functions.
* The "Sub." input method appears to have the smallest angular distances for BAST-NSP, while it shows the largest differences for BAST-SP under AD loss.
### Interpretation
The data suggests that the choice of loss function and input method significantly impacts the angular distance between "left" and "right" conditions, and this impact differs depending on whether BAST-NSP or BAST-SP is used. The statistically significant difference observed in the MSE loss with "Concat." input for BAST-NSP indicates that this combination may lead to a more pronounced distinction between the two conditions. The substantial difference in BAST-SP under AD loss with the "Sub." input suggests that this combination may be particularly sensitive to differences between the "left" and "right" conditions, potentially highlighting a specific aspect of the data that is captured by this configuration. The large angular distances observed with AD loss for BAST-SP could indicate a greater degree of dissimilarity or error in representing the data under this condition. The overall pattern suggests that the optimal configuration (loss function and input method) depends on the specific task (BAST-NSP vs. BAST-SP) and the desired level of sensitivity to differences between the "left" and "right" conditions.