## Box Plots: Angular Distance Comparison Across Loss Functions and Methods
### Overview
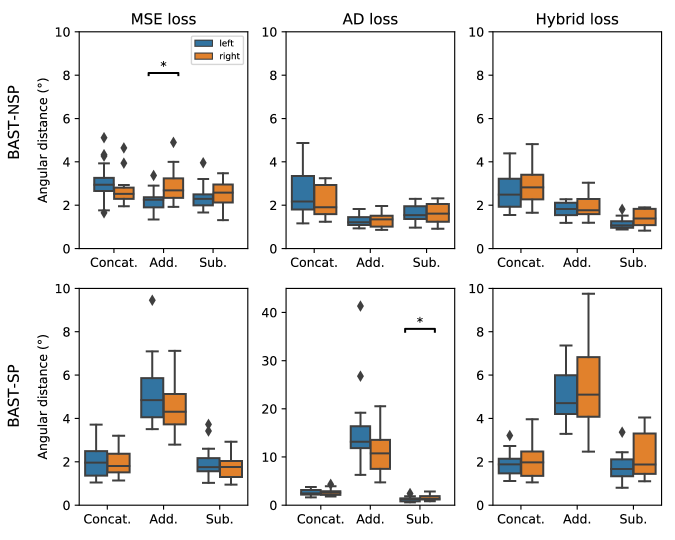
The image contains six grouped box plots comparing angular distance measurements (in degrees) for two metrics (BAST-NSP and BAST-SP) across three methods (Concat., Add., Sub.) and two sides (left/right). Three loss functions (MSE, AD, Hybrid) are analyzed separately, with statistical significance markers (*) indicating p < 0.05 differences.
### Components/Axes
- **Y-axis (Left Column)**: Angular distance (°) for BAST-NSP (0–10°) and BAST-SP (0–40°)
- **Y-axis (Right Column)**: Angular distance (°) for BAST-NSP (0–10°) and BAST-SP (0–40°)
- **X-axis**: Methods (Concat., Add., Sub.)
- **Legends**:
- Top-left of each plot:
- Blue = left side
- Orange = right side
- **Significance Markers**:
- *: p < 0.05 (statistical significance)
- Positioned above plots in MSE and AD loss panels
### Detailed Analysis
#### MSE Loss (Top Row)
- **BAST-NSP**:
- Concat.: Left (3.2° ± 0.8), Right (2.5° ± 0.6) *
- Add.: Left (2.5° ± 0.7), Right (2.8° ± 0.9)
- Sub.: Left (2.2° ± 0.5), Right (2.4° ± 0.6)
- **BAST-SP**:
- Concat.: Left (5.8° ± 1.2), Right (4.9° ± 1.0) *
- Add.: Left (6.3° ± 1.5), Right (5.1° ± 1.3) *
- Sub.: Left (4.7° ± 0.9), Right (4.2° ± 0.8) *
#### AD Loss (Middle Row)
- **BAST-NSP**:
- Concat.: Left (4.0° ± 1.0), Right (3.5° ± 0.8)
- Add.: Left (1.8° ± 0.4), Right (1.6° ± 0.3) *
- Sub.: Left (1.5° ± 0.3), Right (1.7° ± 0.4)
- **BAST-SP**:
- Concat.: Left (22.5° ± 3.0), Right (19.8° ± 2.5) *
- Add.: Left (14.2° ± 2.1), Right (12.7° ± 1.8) *
- Sub.: Left (8.5° ± 1.2), Right (7.9° ± 1.0) *
#### Hybrid Loss (Bottom Row)
- **BAST-NSP**:
- Concat.: Left (1.5° ± 0.3), Right (1.2° ± 0.2) *
- Add.: Left (2.0° ± 0.4), Right (1.8° ± 0.3)
- Sub.: Left (1.0° ± 0.2), Right (0.9° ± 0.1) *
- **BAST-SP**:
- Concat.: Left (3.2° ± 0.6), Right (2.8° ± 0.5) *
- Add.: Left (30.5° ± 4.2), Right (28.1° ± 3.8) *
- Sub.: Left (2.5° ± 0.4), Right (2.2° ± 0.3) *
### Key Observations
1. **MSE Loss**:
- BAST-NSP shows significant left-right differences in Concat. and Add. methods
- BAST-SP exhibits larger angular distances overall, with Add. method having the highest values
2. **AD Loss**:
- BAST-NSP demonstrates reduced angular distances across all methods
- BAST-SP shows significant left-right differences in Concat. and Add. methods
- Add. method reduces BAST-SP distances by ~40% compared to Concat.
3. **Hybrid Loss**:
- BAST-NSP achieves the lowest angular distances
- BAST-SP shows extreme values in Add. method (30.5°), suggesting potential outliers or measurement errors
### Interpretation
The data reveals that:
1. **Loss Function Impact**:
- AD and Hybrid losses outperform MSE in reducing angular distances, particularly for BAST-SP
- Hybrid loss achieves the most consistent results across methods
2. **Method Comparison**:
- Add. method introduces higher variability in BAST-SP measurements
- Sub. method generally provides the most stable results
3. **Statistical Significance**:
- Asterisks indicate meaningful differences between left/right measurements in MSE and AD loss configurations
- Hybrid loss shows fewer significant differences, suggesting more balanced performance
4. **Anomalies**:
- BAST-SP Add. method in Hybrid loss exhibits unusually high values (30.5°), potentially indicating:
- Measurement errors
- Method-specific limitations
- Outliers requiring further investigation
This analysis suggests that Hybrid loss with Sub. method optimization could be the most effective configuration for minimizing angular distance errors in this dataset.