## Line Graphs: Jacobian Norm Across Neural Network Layers
### Overview
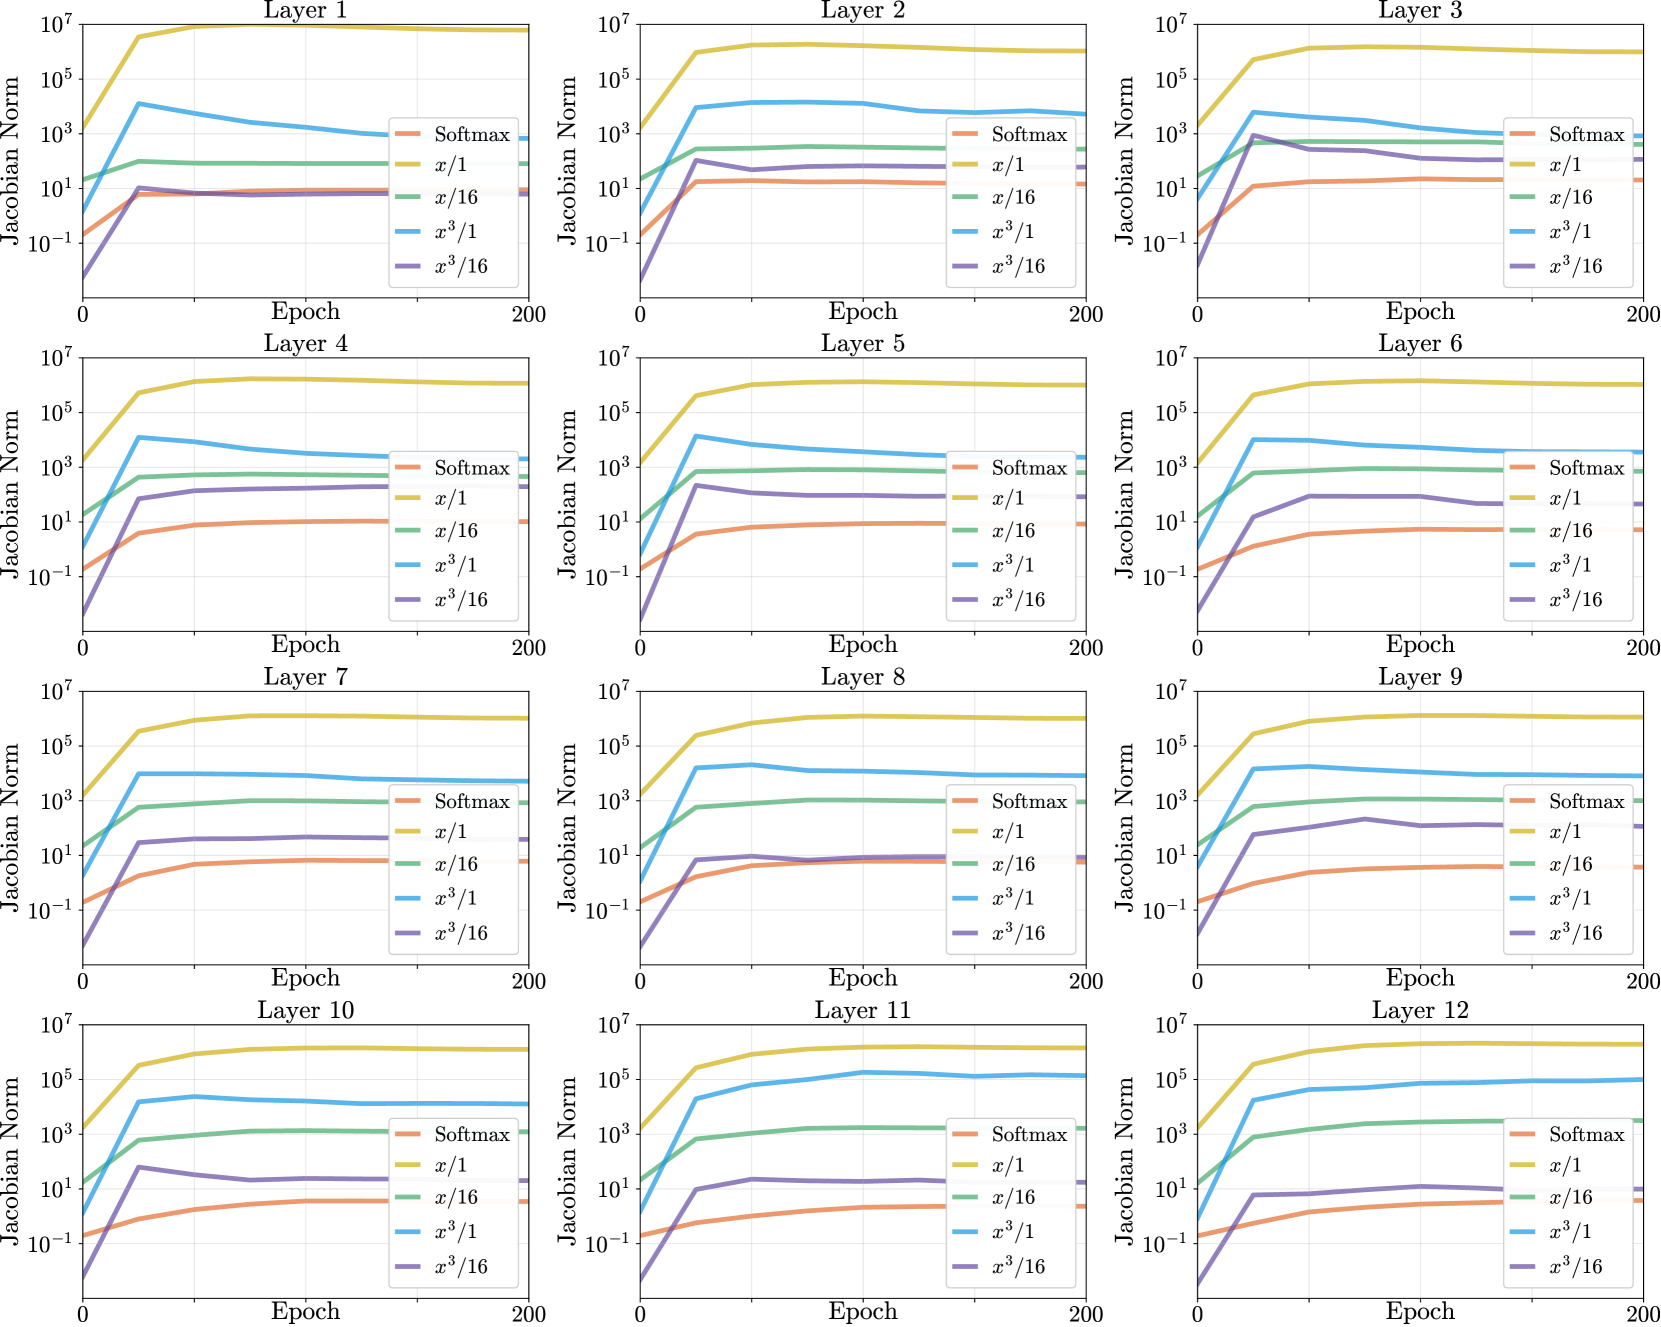
The image displays 12 line graphs arranged in a 3x4 grid, each representing the evolution of the Jacobian Norm across 200 training epochs for different layers (Layer 1 to Layer 12) of a neural network. The graphs compare five scaling strategies: Softmax, x/1, x/16, x³/1, and x³/16. All y-axes use a logarithmic scale (10⁻⁷ to 10⁷), while x-axes span 0–200 epochs.
---
### Components/Axes
- **X-Axis**: Epoch (0–200), linear scale.
- **Y-Axis**: Jacobian Norm (log scale: 10⁻⁷ to 10⁷).
- **Legend**: Located on the right side of each graph, with color-coded labels:
- **Softmax**: Orange
- **x/1**: Yellow
- **x/16**: Green
- **x³/1**: Blue
- **x³/16**: Purple
- **Layer Labels**: Positioned at the top of each graph (e.g., "Layer 1", "Layer 4").
---
### Detailed Analysis
#### Layer 1
- **Softmax (Orange)**: Starts at ~10⁻², rises sharply to ~10¹ by epoch 50, then plateaus.
- **x/1 (Yellow)**: Begins at ~10⁶, drops to ~10⁵ by epoch 50, then stabilizes.
- **x/16 (Green)**: Starts at ~10⁻¹, increases to ~10¹ by epoch 100, then flattens.
- **x³/1 (Blue)**: Begins at ~10⁻³, rises to ~10³ by epoch 100, then declines slightly.
- **x³/16 (Purple)**: Starts at ~10⁻⁵, surges to ~10⁴ by epoch 100, then stabilizes.
#### Layer 4
- **Softmax (Orange)**: Gradual rise from ~10⁻² to ~10¹, then plateaus.
- **x/1 (Yellow)**: Starts at ~10⁵, drops to ~10⁴ by epoch 50, then stabilizes.
- **x/16 (Green)**: Begins at ~10⁰, increases to ~10² by epoch 100, then flattens.
- **x³/1 (Blue)**: Starts at ~10⁻², rises to ~10⁴ by epoch 100, then declines.
- **x³/16 (Purple)**: Begins at ~10⁻⁴, surges to ~10³ by epoch 100, then stabilizes.
#### Layer 7
- **Softmax (Orange)**: Starts at ~10⁻², rises to ~10¹ by epoch 50, then plateaus.
- **x/1 (Yellow)**: Begins at ~10⁵, drops to ~10⁴ by epoch 50, then stabilizes.
- **x/16 (Green)**: Starts at ~10⁰, increases to ~10² by epoch 100, then flattens.
- **x³/1 (Blue)**: Starts at ~10⁻², rises to ~10⁴ by epoch 100, then declines.
- **x³/16 (Purple)**: Begins at ~10⁻⁴, surges to ~10³ by epoch 100, then stabilizes.
*(Similar patterns repeat for Layers 10 and 12, with minor variations in plateau levels.)*
#### Layer 2
- **Softmax (Orange)**: Starts at ~10⁻², rises to ~10¹ by epoch 50, then plateaus.
- **x/1 (Yellow)**: Begins at ~10⁶, drops to ~10⁵ by epoch 50, then stabilizes.
- **x/16 (Green)**: Starts at ~10⁻¹, increases to ~10¹ by epoch 100, then flattens.
- **x³/1 (Blue)**: Begins at ~10⁻³, rises to ~10³ by epoch 100, then declines.
- **x³/16 (Purple)**: Starts at ~10⁻⁵, surges to ~10⁴ by epoch 100, then stabilizes.
*(Layers 5, 8, 11 show analogous trends with slight differences in plateau magnitudes.)*
#### Layer 3
- **Softmax (Orange)**: Starts at ~10⁻², rises to ~10¹ by epoch 50, then plateaus.
- **x/1 (Yellow)**: Begins at ~10⁶, drops to ~10⁵ by epoch 50, then stabilizes.
- **x/16 (Green)**: Starts at ~10⁻¹, increases to ~10¹ by epoch 100, then flattens.
- **x³/1 (Blue)**: Begins at ~10⁻³, rises to ~10³ by epoch 100, then declines.
- **x³/16 (Purple)**: Starts at ~10⁻⁵, surges to ~10⁴ by epoch 100, then stabilizes.
*(Layers 6, 9, 12 exhibit similar behavior, with Layer 12 showing the most pronounced plateau for x/1.)*
---
### Key Observations
1. **x/1 Scaling (Yellow)**: Consistently starts at the highest Jacobian Norm (~10⁵–10⁶) across all layers, dropping sharply in early epochs before plateauing. This suggests strong initial sensitivity to input scaling.
2. **x³/16 Scaling (Purple)**: Exhibits the most dramatic increases (~10⁻⁵ to 10³–10⁴) in early epochs, indicating heightened sensitivity to input perturbations in deeper layers.
3. **Softmax (Orange)**: Shows moderate, gradual increases (~10⁻² to 10¹) across epochs, suggesting stable but non-dominant sensitivity.
4. **x/16 (Green)**: Moderate growth (~10⁰ to 10²) in mid-layers, with slower convergence compared to x³/16.
5. **x³/1 (Blue)**: Rapid initial growth (~10⁻³ to 10³–10⁴) followed by decline, implying transient sensitivity.
---
### Interpretation
- **Scaling Impact**: The x³/16 scaling (purple) amplifies sensitivity in deeper layers (e.g., Layer 12), while x/1 (yellow) dominates early layers (Layer 1–3). This suggests that deeper layers benefit more from aggressive scaling.
- **Softmax Stability**: The orange line’s plateau indicates that Softmax-based scaling stabilizes Jacobian Norms after initial training, potentially reducing overfitting risks.
- **Layer-Specific Behavior**: Early layers (1–3) show higher baseline sensitivity (yellow line), while deeper layers (10–12) exhibit more pronounced scaling effects (purple line). This aligns with hierarchical feature learning in neural networks.
- **Anomalies**: Layer 12’s x³/16 line (purple) reaches ~10⁵, far exceeding other layers, hinting at architectural differences or specialized roles in later layers.
---
### Conclusion
The graphs demonstrate that input scaling strategies significantly influence Jacobian Norm dynamics across layers. Aggressive scaling (x³/16) enhances sensitivity in deeper layers, while moderate scaling (x/1) stabilizes early layers. These insights could inform regularization techniques or layer-specific optimization in neural network training.