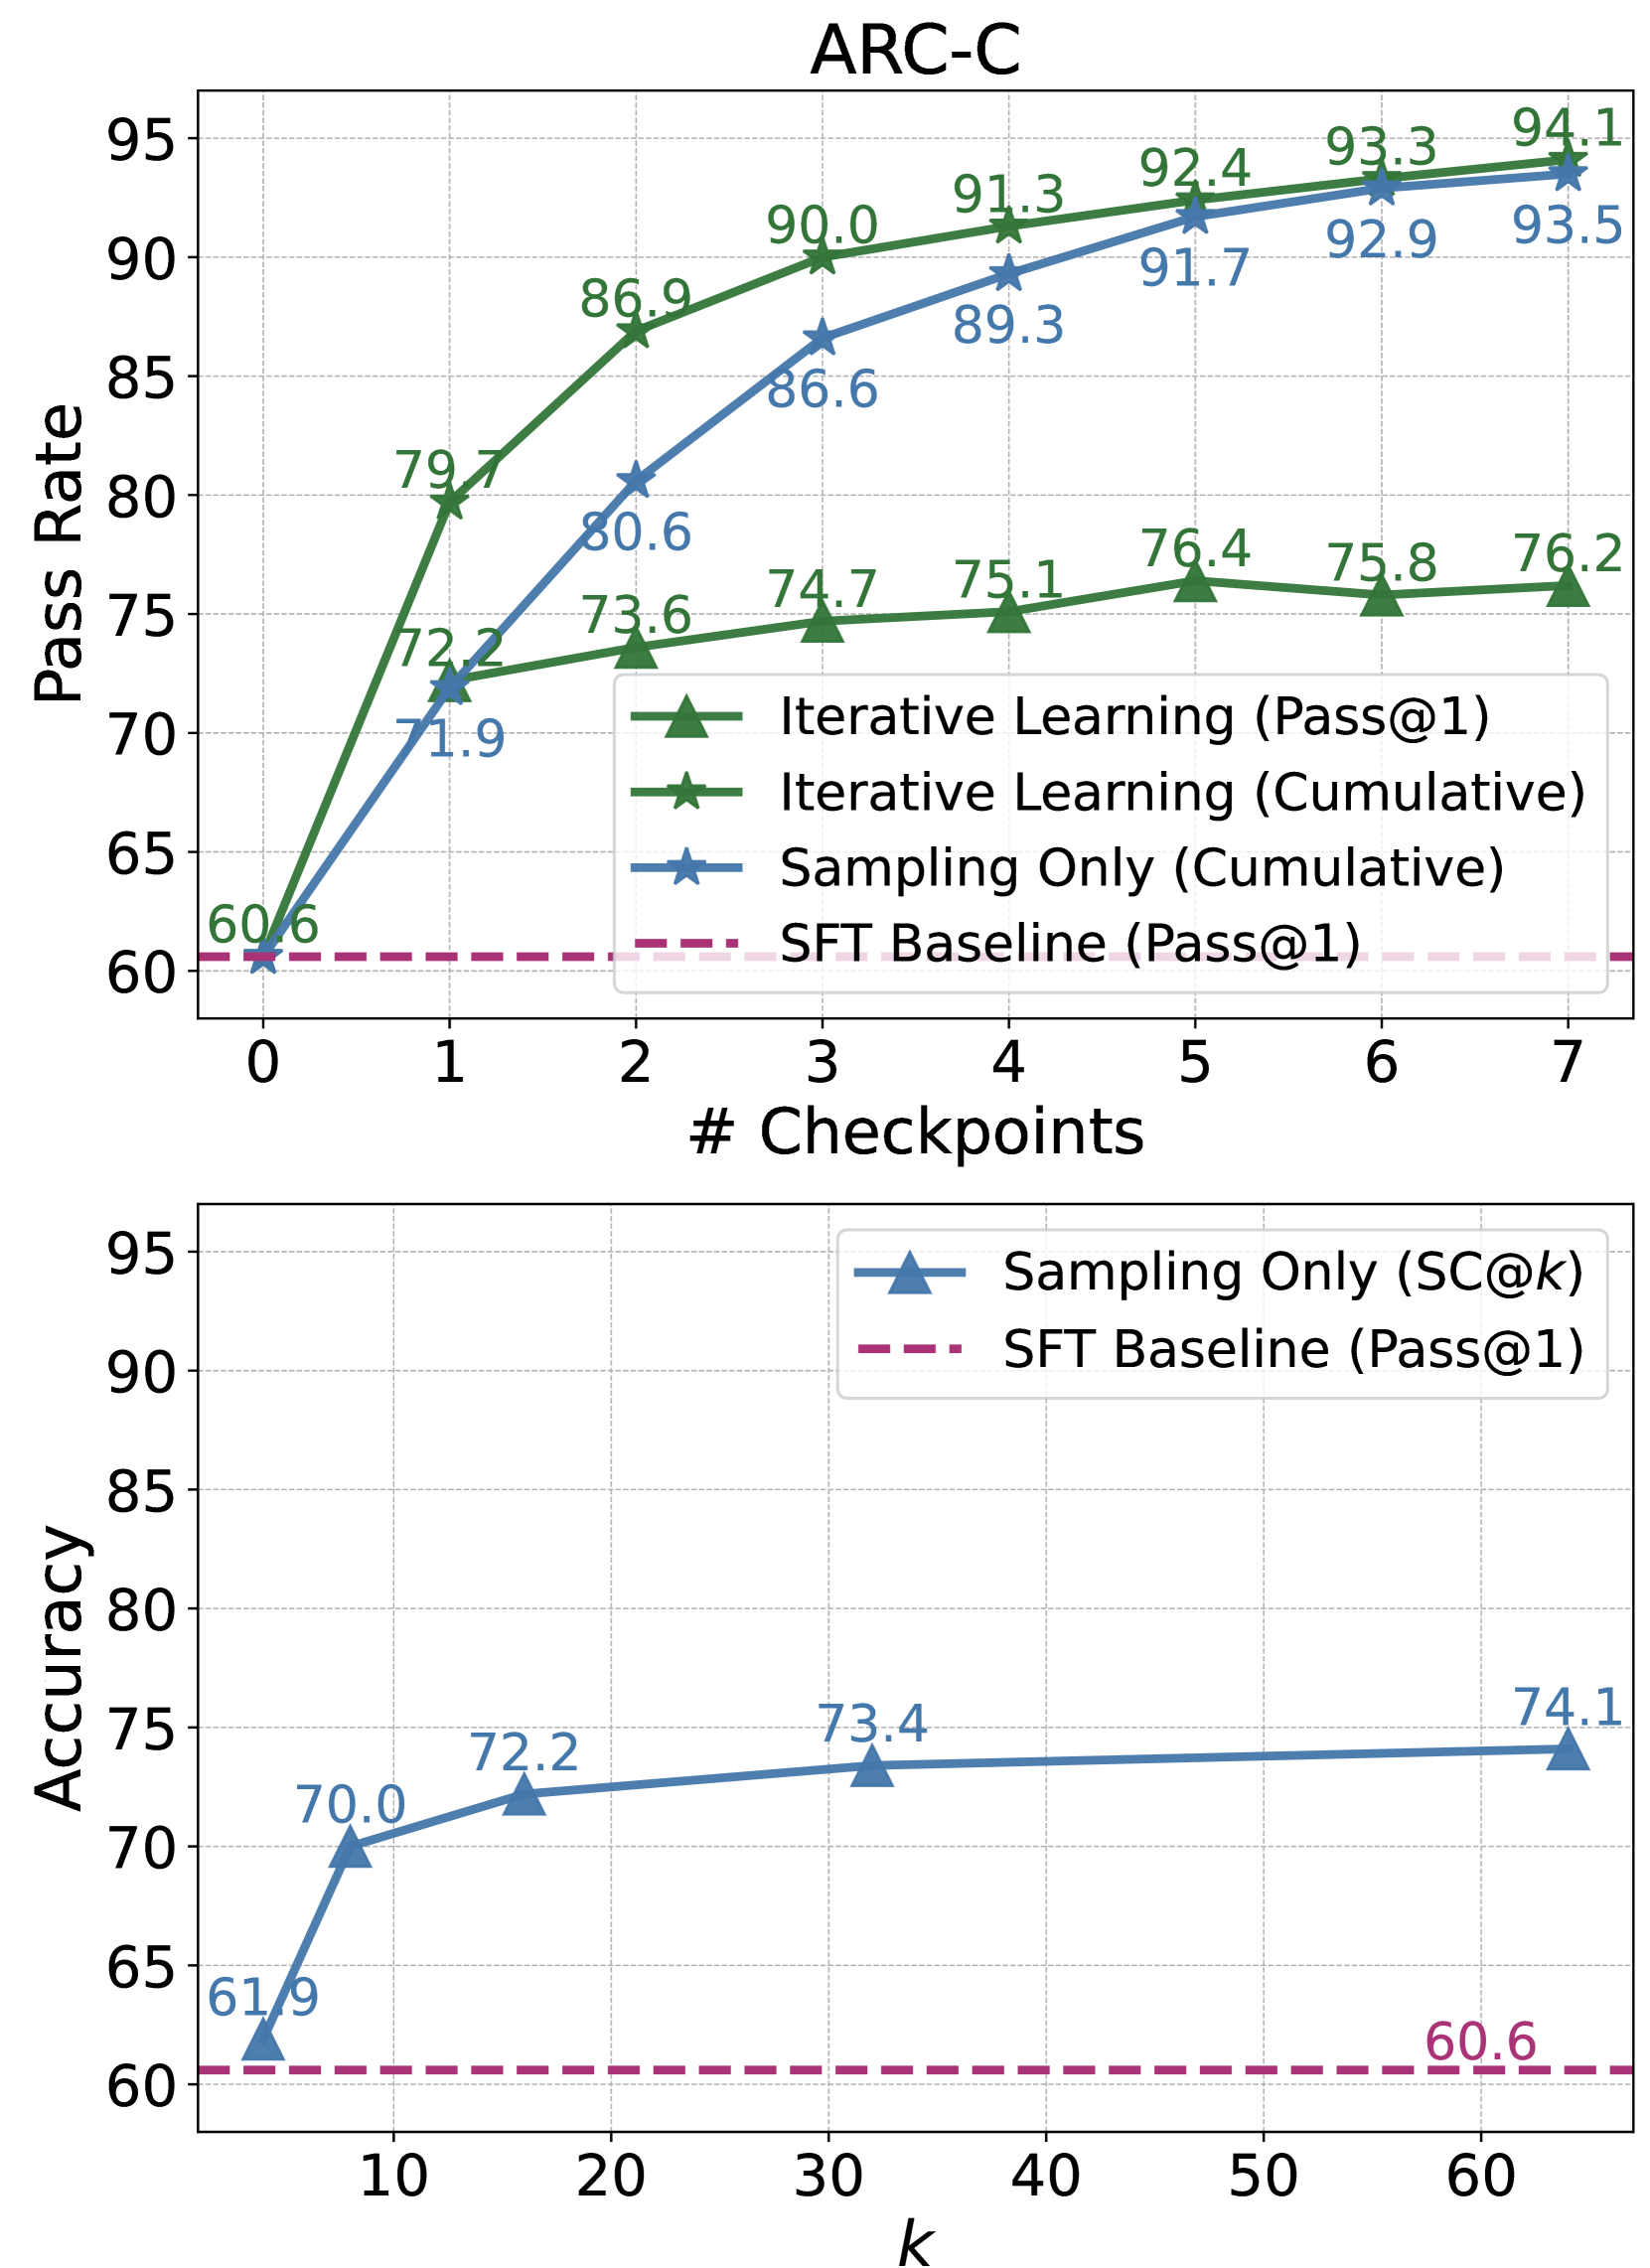
## Line Charts: ARC-C Performance and Accuracy Metrics
### Overview
The image contains two line charts comparing performance metrics across different training approaches. The top chart ("ARC-C") tracks pass rates against checkpoint progression, while the bottom chart ("Accuracy") measures accuracy against sampling iterations. Both include baseline comparisons and show distinct performance trajectories.
### Components/Axes
**Top Chart (ARC-C):**
- **Y-axis**: Pass Rate (60-95)
- **X-axis**: # Checkpoints (0-7)
- **Legend**:
- Green triangles: Iterative Learning (Pass@1)
- Green stars: Iterative Learning (Cumulative)
- Blue stars: Sampling Only (Cumulative)
- Red dashed line: SFT Baseline (Pass@1)
**Bottom Chart (Accuracy):**
- **Y-axis**: Accuracy (60-95)
- **X-axis**: k (10-60)
- **Legend**:
- Blue triangles: Sampling Only (SC@k)
- Red dashed line: SFT Baseline (Pass@1)
### Detailed Analysis
**ARC-C Chart Data Points:**
- **Iterative Learning (Pass@1)**:
- 0: 60.6 → 1: 79.7 → 2: 86.9 → 3: 90.0 → 4: 91.3 → 5: 92.4 → 6: 93.3 → 7: 94.1
- **Iterative Learning (Cumulative)**:
- 0: 60.6 → 1: 72.2 → 2: 73.6 → 3: 74.7 → 4: 75.1 → 5: 76.4 → 6: 75.8 → 7: 76.2
- **Sampling Only (Cumulative)**:
- 0: 60.6 → 1: 71.9 → 2: 80.6 → 3: 86.6 → 4: 89.3 → 5: 91.7 → 6: 92.9 → 7: 93.5
- **SFT Baseline**: Constant 60.6 across all checkpoints
**Accuracy Chart Data Points:**
- **Sampling Only (SC@k)**:
- k=10: 61.9 → k=20: 72.2 → k=30: 73.4 → k=60: 74.1
- **SFT Baseline**: Constant 60.6 across all k values
### Key Observations
1. **ARC-C Performance**:
- Iterative Learning (Pass@1) shows exponential growth, reaching 94.1 at 7 checkpoints
- Cumulative metrics plateau earlier (76.2 at 7 checkpoints) vs Pass@1
- Sampling Only closes the gap significantly by checkpoint 7 (93.5 vs 94.1)
- SFT Baseline remains static at 60.6, indicating poor scalability
2. **Accuracy Trends**:
- Sampling Only improves gradually (61.9 → 74.1) with increasing k
- SFT Baseline shows no improvement despite increased sampling
- Sampling Only achieves 13.5 accuracy point improvement over baseline
### Interpretation
The data demonstrates that iterative learning methods outperform static SFT baselines, with cumulative approaches showing diminishing returns after initial checkpoints. Sampling-based methods (both iterative and standalone) achieve near-parity with iterative learning by checkpoint 7, suggesting sampling efficiency improves with scale. The SFT baseline's stagnation across both metrics indicates fundamental limitations in static training approaches for complex tasks requiring iterative refinement. The convergence of Sampling Only and Iterative Learning metrics at higher checkpoints implies that sampling strategies may effectively approximate iterative learning benefits at scale.