TECHNICAL ASSET FINGERPRINT
05b4e66fe5894e2e539a8a21
Click to view fullscreen
Press ESC or click to close
FOUND IN PAPERS
EXPERT: gemini-2.0-flash VERSION 1
RUNTIME: nugit/gemini/gemini-2.0-flash
INTEL_VERIFIED
## Chart: Metric Values, Normalized MFPT/WHR, and Rationality Minima vs. Lambda
### Overview
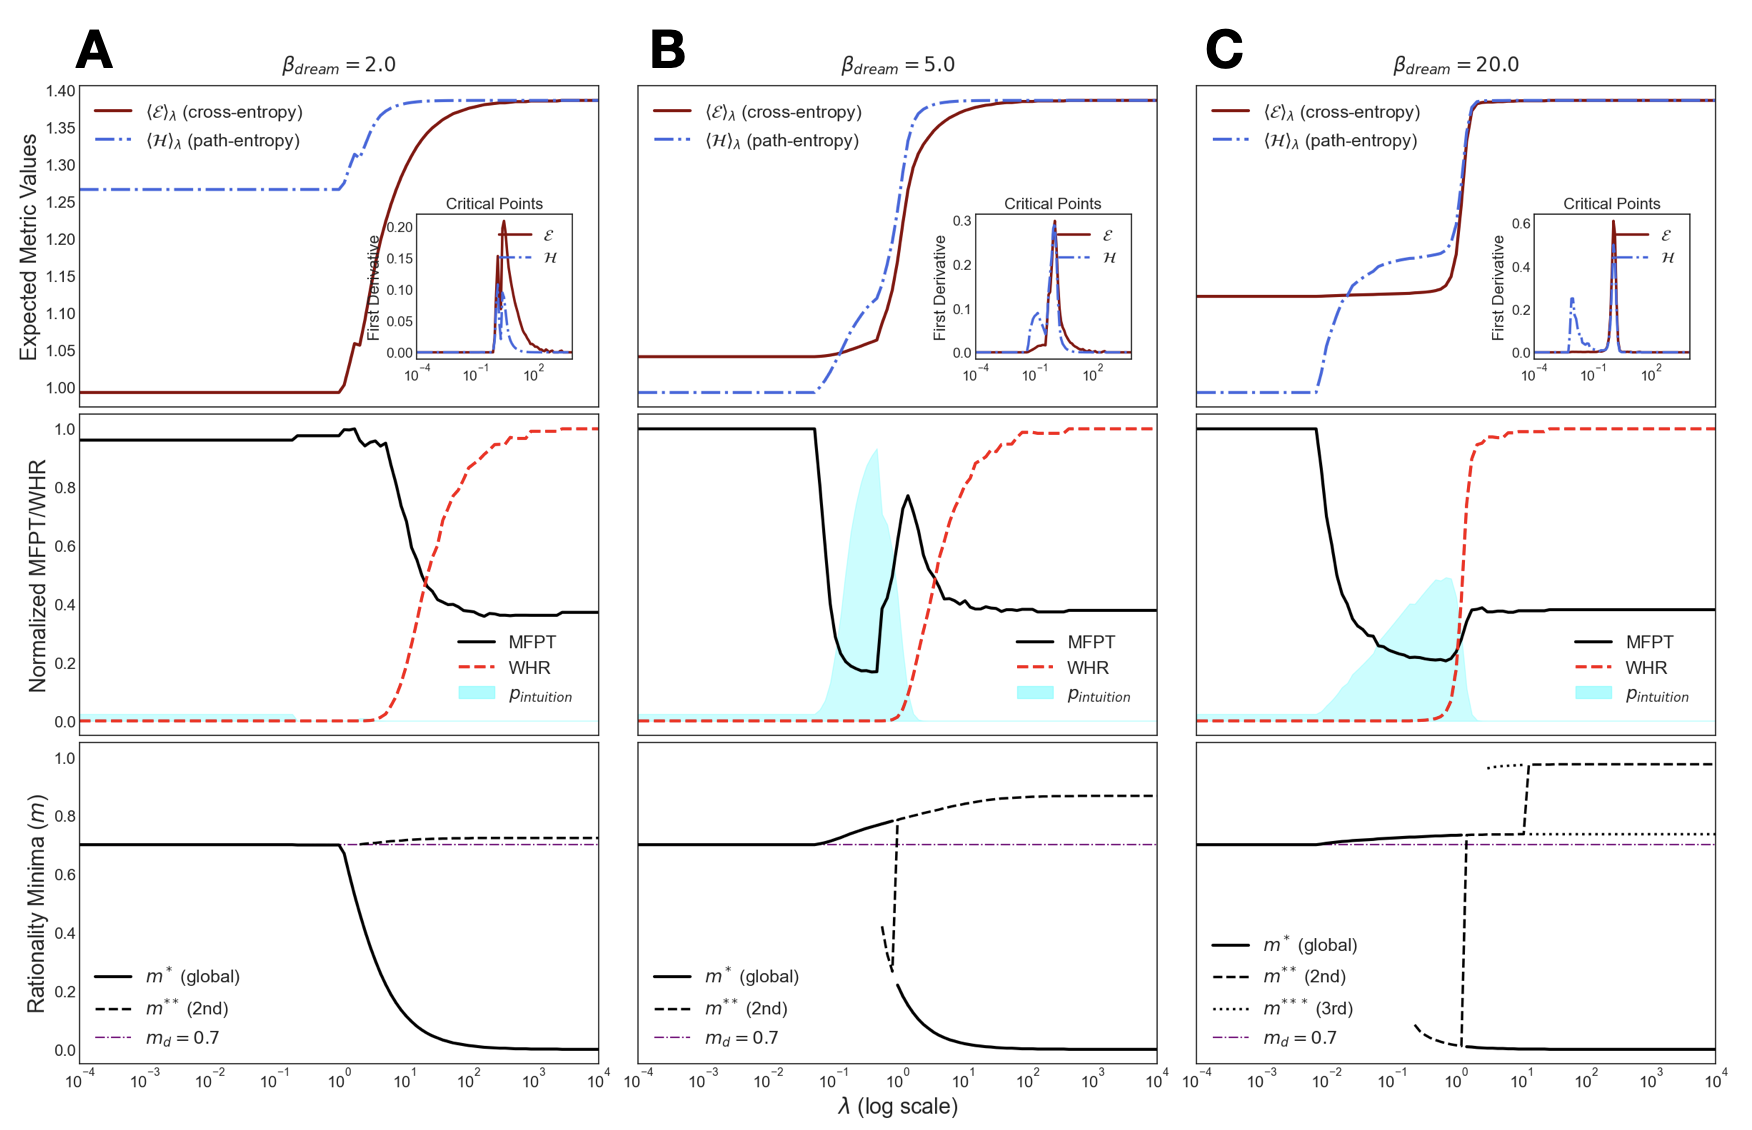
The image presents three sets of plots (A, B, and C) that illustrate the relationship between various metrics and the parameter lambda (λ) on a logarithmic scale. Each set of plots corresponds to a different value of β_dream (2.0, 5.0, and 20.0). The plots show the expected metric values (cross-entropy and path-entropy), normalized MFPT/WHR, and rationality minima as functions of lambda. Each set contains three vertically stacked plots.
### Components/Axes
**General Layout:**
* The image is divided into three columns labeled A, B, and C, corresponding to β_dream values of 2.0, 5.0, and 20.0, respectively.
* Each column contains three vertically stacked plots.
**Top Row Plots (Expected Metric Values):**
* **Y-axis:** "Expected Metric Values", ranging from 1.00 to 1.40.
* **Data Series:**
* `(E)_λ` (cross-entropy): Solid brown line.
* `(H)_λ` (path-entropy): Blue dash-dot line.
* **Inset Plot (Critical Points):**
* **Y-axis:** "First Derivative"
* **Data Series:**
* `E`: Solid brown line.
* `H`: Blue dash-dot line.
* **X-axis (Inset):** Same as main plot, lambda (log scale)
* **X-axis:** Lambda (λ) (log scale), ranging from 10^-4 to 10^4.
**Middle Row Plots (Normalized MFPT/WHR):**
* **Y-axis:** "Normalized MFPT/WHR", ranging from 0.0 to 1.0.
* **Data Series:**
* MFPT: Solid black line.
* WHR: Red dashed line.
* p_intuition: Light blue shaded area.
* **X-axis:** Lambda (λ) (log scale), ranging from 10^-4 to 10^4.
**Bottom Row Plots (Rationality Minima):**
* **Y-axis:** "Rationality Minima (m)", ranging from 0.0 to 1.0.
* **Data Series:**
* m* (global): Solid black line.
* m** (2nd): Dashed black line.
* m*** (3rd): Dotted black line (only present in plot C).
* m_d = 0.7: Magenta dash-dot line.
* **X-axis:** Lambda (λ) (log scale), ranging from 10^-4 to 10^4.
### Detailed Analysis
**Column A (β_dream = 2.0):**
* **Top Plot:**
* `(E)_λ` (cross-entropy): Starts at approximately 1.00 and increases sharply around λ = 10^-1, reaching a plateau at approximately 1.38.
* `(H)_λ` (path-entropy): Starts at approximately 1.27 and increases sharply around λ = 10^-1, reaching a plateau at approximately 1.38.
* **Inset Plot:** The first derivative of E peaks around 10^-1 at approximately 0.18. The first derivative of H peaks around 10^-1 at approximately 0.10.
* **Middle Plot:**
* MFPT: Starts at approximately 0.98 and decreases sharply around λ = 10^-1, reaching a plateau at approximately 0.2.
* WHR: Starts at approximately 0.0 and increases sharply around λ = 10^-1, reaching a plateau at approximately 1.0.
* p_intuition: A small bump is visible around λ = 10^-1.
* **Bottom Plot:**
* m* (global): Starts at approximately 0.7 and decreases sharply around λ = 10^-1, reaching a plateau at approximately 0.0.
* m** (2nd): Remains constant at approximately 0.7.
* m_d = 0.7: Constant at 0.7.
**Column B (β_dream = 5.0):**
* **Top Plot:**
* `(E)_λ` (cross-entropy): Starts at approximately 1.00 and increases sharply around λ = 10^-1, reaching a plateau at approximately 1.38.
* `(H)_λ` (path-entropy): Starts at approximately 1.00 and increases sharply around λ = 10^-1, reaching a plateau at approximately 1.38.
* **Inset Plot:** The first derivative of E peaks around 10^-1 at approximately 0.25. The first derivative of H peaks around 10^-1 at approximately 0.15.
* **Middle Plot:**
* MFPT: Starts at approximately 0.98 and decreases sharply around λ = 10^-1, reaching a plateau at approximately 0.2.
* WHR: Starts at approximately 0.0 and increases sharply around λ = 10^-1, reaching a plateau at approximately 1.0.
* p_intuition: A larger bump is visible around λ = 10^-1.
* **Bottom Plot:**
* m* (global): Starts at approximately 0.7 and decreases sharply around λ = 10^-1, reaching a plateau at approximately 0.0.
* m** (2nd): Increases sharply around λ = 10^-1, reaching a plateau at approximately 0.7.
* m_d = 0.7: Constant at 0.7.
**Column C (β_dream = 20.0):**
* **Top Plot:**
* `(E)_λ` (cross-entropy): Starts at approximately 1.00 and increases sharply around λ = 10^-1, reaching a plateau at approximately 1.38.
* `(H)_λ` (path-entropy): Starts at approximately 1.00 and increases sharply around λ = 10^-1, reaching a plateau at approximately 1.38.
* **Inset Plot:** The first derivative of E peaks around 10^-1 at approximately 0.55. The first derivative of H peaks around 10^-1 at approximately 0.30.
* **Middle Plot:**
* MFPT: Starts at approximately 0.98 and decreases sharply around λ = 10^-1, reaching a plateau at approximately 0.2.
* WHR: Starts at approximately 0.0 and increases sharply around λ = 10^-1, reaching a plateau at approximately 1.0.
* p_intuition: A larger bump is visible around λ = 10^-1.
* **Bottom Plot:**
* m* (global): Starts at approximately 0.7 and decreases sharply around λ = 10^-1, reaching a plateau at approximately 0.0.
* m** (2nd): Increases sharply around λ = 10^-1, reaching a plateau at approximately 0.7.
* m*** (3rd): Increases sharply around λ = 10^-1, reaching a plateau at approximately 0.7.
* m_d = 0.7: Constant at 0.7.
### Key Observations
* As β_dream increases, the peak of the first derivative for both E and H in the inset plots increases.
* The transition point for MFPT and WHR remains relatively constant around λ = 10^-1 across all three β_dream values.
* The magnitude of p_intuition increases with increasing β_dream.
* The behavior of rationality minima changes with increasing β_dream, with m*** appearing only at β_dream = 20.0.
### Interpretation
The plots illustrate how different values of β_dream influence the relationship between lambda (λ) and various metrics related to cross-entropy, path-entropy, MFPT, WHR, and rationality minima. The sharp transitions observed around λ = 10^-1 suggest a critical point or threshold in the system's behavior. The increase in the peak of the first derivative for E and H with increasing β_dream indicates a more pronounced change in these metrics around the critical point. The increasing magnitude of p_intuition suggests that intuition plays a more significant role as β_dream increases. The changes in rationality minima indicate a shift in the system's rationality landscape with varying β_dream.
DECODING INTELLIGENCE...