TECHNICAL ASSET FINGERPRINT
05f39442d86514178fe81d10
Click to view fullscreen
Press ESC or click to close
FOUND IN PAPERS
EXPERT: gemini-2.0-flash VERSION 1
RUNTIME: nugit/gemini/gemini-2.0-flash
INTEL_VERIFIED
## Line Graphs: "I-Don't-Know" Rate vs. Layer for Mistral-7B-v0.1 and Mistral-7B-v0.3
### Overview
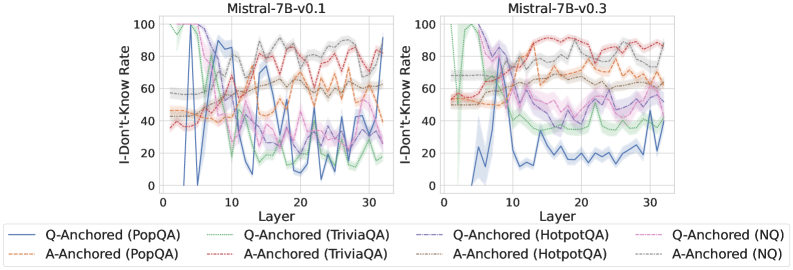
The image presents two line graphs comparing the "I-Don't-Know" rate across different layers of the Mistral-7B model, specifically versions v0.1 and v0.3. Each graph plots the "I-Don't-Know" rate (y-axis) against the layer number (x-axis) for various question-answering (QA) tasks, distinguished by whether the question (Q) or answer (A) is anchored and the specific dataset used (PopQA, TriviaQA, HotpotQA, NQ). The graphs aim to illustrate how the model's uncertainty varies across layers and between the two versions.
### Components/Axes
* **Titles:**
* Left Graph: "Mistral-7B-v0.1"
* Right Graph: "Mistral-7B-v0.3"
* **Y-Axis:**
* Label: "I-Don't-Know Rate"
* Scale: 0 to 100, with tick marks at 0, 20, 40, 60, 80, and 100.
* **X-Axis:**
* Label: "Layer"
* Scale: 0 to 30, with tick marks at intervals of 5 (0, 10, 20, 30).
* **Legend:** Located at the bottom of the image, it identifies the different QA tasks represented by different colored lines:
* Blue: Q-Anchored (PopQA)
* Brown Dashed: A-Anchored (PopQA)
* Green Dotted: Q-Anchored (TriviaQA)
* Purple Dashed: A-Anchored (TriviaQA)
* Gray Dashed: Q-Anchored (HotpotQA)
* Orange Dotted: A-Anchored (HotpotQA)
* Red Dashed: Q-Anchored (NQ)
* Black Dotted: A-Anchored (NQ)
### Detailed Analysis
#### Mistral-7B-v0.1 (Left Graph)
* **Q-Anchored (PopQA) - Blue:** Starts at 100% at layer 0, drops sharply to near 0% by layer 10, then fluctuates between 0% and 40% for the remaining layers.
* Values: ~100% at layer 0, ~0% at layer 10, fluctuates between ~0-40% from layer 10-30.
* **A-Anchored (PopQA) - Brown Dashed:** Starts around 45% and remains relatively stable between 40% and 60% across all layers.
* Values: Stays between ~40-60% from layer 0-30.
* **Q-Anchored (TriviaQA) - Green Dotted:** Starts at 0% at layer 0, rises sharply to 100% at layer 5, then fluctuates between 0% and 60% for the remaining layers.
* Values: ~0% at layer 0, ~100% at layer 5, fluctuates between ~0-60% from layer 5-30.
* **A-Anchored (TriviaQA) - Purple Dashed:** Starts around 40% at layer 0, drops to 20% at layer 10, then fluctuates between 20% and 60% for the remaining layers.
* Values: ~40% at layer 0, ~20% at layer 10, fluctuates between ~20-60% from layer 10-30.
* **Q-Anchored (HotpotQA) - Gray Dashed:** Starts around 50% and remains relatively stable between 40% and 80% across all layers.
* Values: Stays between ~40-80% from layer 0-30.
* **A-Anchored (HotpotQA) - Orange Dotted:** Starts around 50% and remains relatively stable between 50% and 70% across all layers.
* Values: Stays between ~50-70% from layer 0-30.
* **Q-Anchored (NQ) - Red Dashed:** Starts around 40% and fluctuates between 40% and 90% across all layers.
* Values: Fluctuates between ~40-90% from layer 0-30.
* **A-Anchored (NQ) - Black Dotted:** Starts around 50% and fluctuates between 40% and 70% across all layers.
* Values: Fluctuates between ~40-70% from layer 0-30.
#### Mistral-7B-v0.3 (Right Graph)
* **Q-Anchored (PopQA) - Blue:** Starts at 0% at layer 0, rises to 40% at layer 5, then fluctuates between 10% and 40% for the remaining layers.
* Values: ~0% at layer 0, ~40% at layer 5, fluctuates between ~10-40% from layer 5-30.
* **A-Anchored (PopQA) - Brown Dashed:** Starts around 65% and remains relatively stable between 60% and 80% across all layers.
* Values: Stays between ~60-80% from layer 0-30.
* **Q-Anchored (TriviaQA) - Green Dotted:** Starts at 60% at layer 0, rises to 100% at layer 5, then fluctuates between 40% and 60% for the remaining layers.
* Values: ~60% at layer 0, ~100% at layer 5, fluctuates between ~40-60% from layer 5-30.
* **A-Anchored (TriviaQA) - Purple Dashed:** Starts around 70% at layer 0, drops to 40% at layer 10, then fluctuates between 40% and 60% for the remaining layers.
* Values: ~70% at layer 0, ~40% at layer 10, fluctuates between ~40-60% from layer 10-30.
* **Q-Anchored (HotpotQA) - Gray Dashed:** Starts around 70% and remains relatively stable between 70% and 90% across all layers.
* Values: Stays between ~70-90% from layer 0-30.
* **A-Anchored (HotpotQA) - Orange Dotted:** Starts around 70% and remains relatively stable between 70% and 80% across all layers.
* Values: Stays between ~70-80% from layer 0-30.
* **Q-Anchored (NQ) - Red Dashed:** Starts around 70% and fluctuates between 70% and 90% across all layers.
* Values: Fluctuates between ~70-90% from layer 0-30.
* **A-Anchored (NQ) - Black Dotted:** Starts around 60% and fluctuates between 60% and 80% across all layers.
* Values: Fluctuates between ~60-80% from layer 0-30.
### Key Observations
* **Q-Anchored (PopQA):** Shows a significant drop in "I-Don't-Know" rate in v0.1, starting high and decreasing rapidly, while in v0.3, it starts low and remains relatively low.
* **Overall Stability:** Most of the other QA tasks show relatively stable "I-Don't-Know" rates across layers in both versions, with some fluctuations.
* **Version Comparison:** The "I-Don't-Know" rates for most tasks are generally higher in v0.3 compared to v0.1, suggesting a potential increase in uncertainty or a change in the model's confidence calibration.
### Interpretation
The graphs provide insights into how the Mistral-7B model's uncertainty, as measured by the "I-Don't-Know" rate, varies across different layers and QA tasks. The most notable difference between versions v0.1 and v0.3 is the behavior of the Q-Anchored (PopQA) task, where v0.1 shows a significant decrease in the "I-Don't-Know" rate as the layers progress, while v0.3 maintains a low rate throughout. This suggests that the model's ability to handle PopQA questions has improved or changed significantly between the two versions.
The relatively stable "I-Don't-Know" rates for other tasks indicate that the model's uncertainty is consistent across layers for those specific QA scenarios. The generally higher rates in v0.3 might reflect a deliberate recalibration of the model's confidence, potentially trading off some accuracy for increased awareness of its limitations.
These findings are valuable for understanding the model's strengths and weaknesses in different QA tasks and for guiding further development and refinement of the Mistral-7B model. The differences between the two versions highlight the impact of specific training or architectural changes on the model's uncertainty and performance.
DECODING INTELLIGENCE...