\n
## Line Chart: Router Stability Across Layers and Noise Levels
### Overview
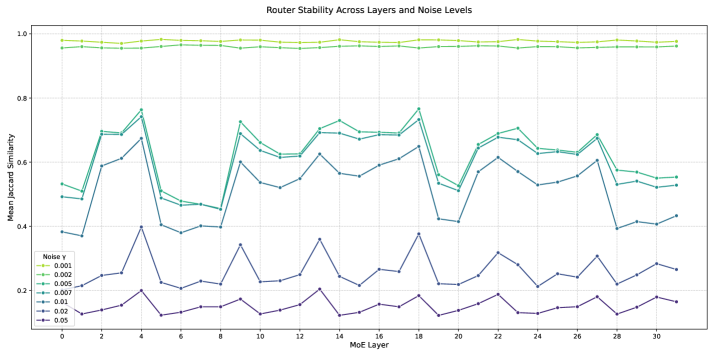
The image presents a line chart illustrating the relationship between Router Stability (measured by Mean Jaccard Similarity) and MoE Layer, across different Noise Levels. The chart displays multiple lines, each representing a different noise level, showing how stability changes as the MoE layer increases.
### Components/Axes
* **Title:** "Router Stability Across Layers and Noise Levels" - positioned at the top-center.
* **X-axis:** "MoE Layer" - ranging from 0 to 30, with tick marks at integer values.
* **Y-axis:** "Mean Jaccard Similarity" - ranging from approximately 0.2 to 1.0, with tick marks at 0.2 intervals.
* **Legend:** Located in the bottom-left corner, listing the Noise Levels (γ) and their corresponding line colors:
* γ = 0.001 (Yellow)
* γ = 0.002 (Light Green)
* γ = 0.005 (Teal)
* γ = 0.01 (Dark Blue)
* γ = 0.05 (Purple)
### Detailed Analysis
The chart contains five lines, each representing a different noise level.
* **γ = 0.001 (Yellow):** The line is relatively flat, maintaining a high Mean Jaccard Similarity of approximately 0.98 throughout the MoE layers. There is a slight downward trend from layer 0 to layer 30, ending at approximately 0.96.
* **γ = 0.002 (Light Green):** This line starts at approximately 0.95 at layer 0, dips to around 0.85 at layer 2, then fluctuates between 0.9 and 0.95 for the remainder of the layers, ending at approximately 0.92 at layer 30.
* **γ = 0.005 (Teal):** This line exhibits more significant fluctuations. It starts at approximately 0.75 at layer 0, peaks around 0.85 at layer 2, then dips to approximately 0.4 at layer 4. It then oscillates between approximately 0.4 and 0.7, ending at approximately 0.6 at layer 30.
* **γ = 0.01 (Dark Blue):** This line shows the most pronounced fluctuations. It starts at approximately 0.3 at layer 0, rises to a peak of approximately 0.45 at layer 2, then drops to approximately 0.25 at layer 4. It continues to oscillate, reaching a maximum of approximately 0.45 at layer 20 and ending at approximately 0.35 at layer 30.
* **γ = 0.05 (Purple):** This line starts at approximately 0.2 at layer 0, rises to a peak of approximately 0.3 at layer 2, then fluctuates between approximately 0.2 and 0.35, ending at approximately 0.25 at layer 30.
### Key Observations
* Higher noise levels (γ = 0.01 and γ = 0.05) exhibit significantly lower and more volatile Mean Jaccard Similarity scores compared to lower noise levels.
* The stability generally decreases as the noise level increases.
* All lines show some degree of fluctuation, indicating that router stability is not constant across MoE layers.
* The γ = 0.001 line demonstrates the highest and most stable router stability.
### Interpretation
The data suggests that router stability is sensitive to noise levels. As the noise level increases, the router's ability to maintain consistent connections (as measured by Jaccard Similarity) decreases. The fluctuations observed in all lines indicate that the stability is not uniform across different MoE layers, potentially due to variations in network conditions or routing decisions. The relatively stable performance of the γ = 0.001 line suggests that minimizing noise is crucial for maintaining robust router stability. The chart highlights a trade-off between noise and stability, and the need for strategies to mitigate the impact of noise on router performance. The oscillations in the lines could be indicative of periodic changes in network topology or traffic patterns. The data could be used to inform the design of more resilient routing protocols or to optimize network parameters for specific noise environments.