\n
## Diagram: Accuracy Assessment Flowchart
### Overview
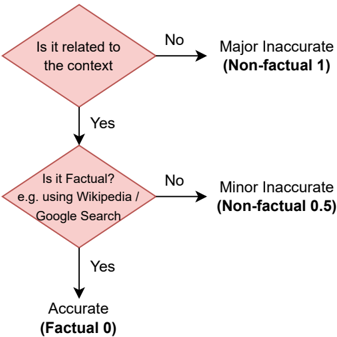
This image presents a flowchart illustrating a process for assessing the accuracy of information. The flowchart consists of two decision diamonds and three terminal states, representing different levels of accuracy. The flowchart visually guides the user through a series of questions to determine if a piece of information is accurate, minorly inaccurate, or majorly inaccurate.
### Components/Axes
The diagram consists of:
* **Decision Diamond 1:** "Is it related to the context?" with "No" and "Yes" branches.
* **Decision Diamond 2:** "Is it Factual? e.g. using Wikipedia / Google Search" with "No" and "Yes" branches.
* **Terminal State 1:** "Major Inaccurate (Non-factual 1)"
* **Terminal State 2:** "Minor Inaccurate (Non-factual 0.5)"
* **Terminal State 3:** "Accurate (Factual 0)"
* Arrows indicating the flow of the assessment process.
### Detailed Analysis or Content Details
The flowchart begins with the question "Is it related to the context?".
* If the answer is "No", the flow leads to "Major Inaccurate (Non-factual 1)".
* If the answer is "Yes", the flow proceeds to the second decision diamond.
The second question is "Is it Factual? e.g. using Wikipedia / Google Search".
* If the answer is "No", the flow leads to "Minor Inaccurate (Non-factual 0.5)".
* If the answer is "Yes", the flow leads to "Accurate (Factual 0)".
The terminal states are associated with numerical values representing the degree of inaccuracy:
* Major Inaccurate: 1
* Minor Inaccurate: 0.5
* Accurate: 0
### Key Observations
The flowchart establishes a hierarchical assessment of accuracy. Relevance to the context is the first criterion, followed by factual verification using external sources like Wikipedia or Google Search. The numerical values assigned to each state suggest a scale of inaccuracy, where 0 represents complete accuracy and 1 represents complete inaccuracy.
### Interpretation
This diagram outlines a simple but effective method for evaluating information. It emphasizes the importance of both contextual relevance and factual basis. The use of external sources (Wikipedia/Google Search) as a benchmark for factual accuracy suggests a reliance on established knowledge. The numerical scoring system allows for a degree of quantification of accuracy, which could be useful in automated systems or for comparative analysis. The flowchart implies that information can be inaccurate in two ways: by being irrelevant to the context or by being factually incorrect. The diagram is a conceptual model and does not provide specific data or measurements, but rather a framework for assessment. It is a visual representation of a logical process.