## Diagram: Path Planning and State Estimation in 2D Space
### Overview
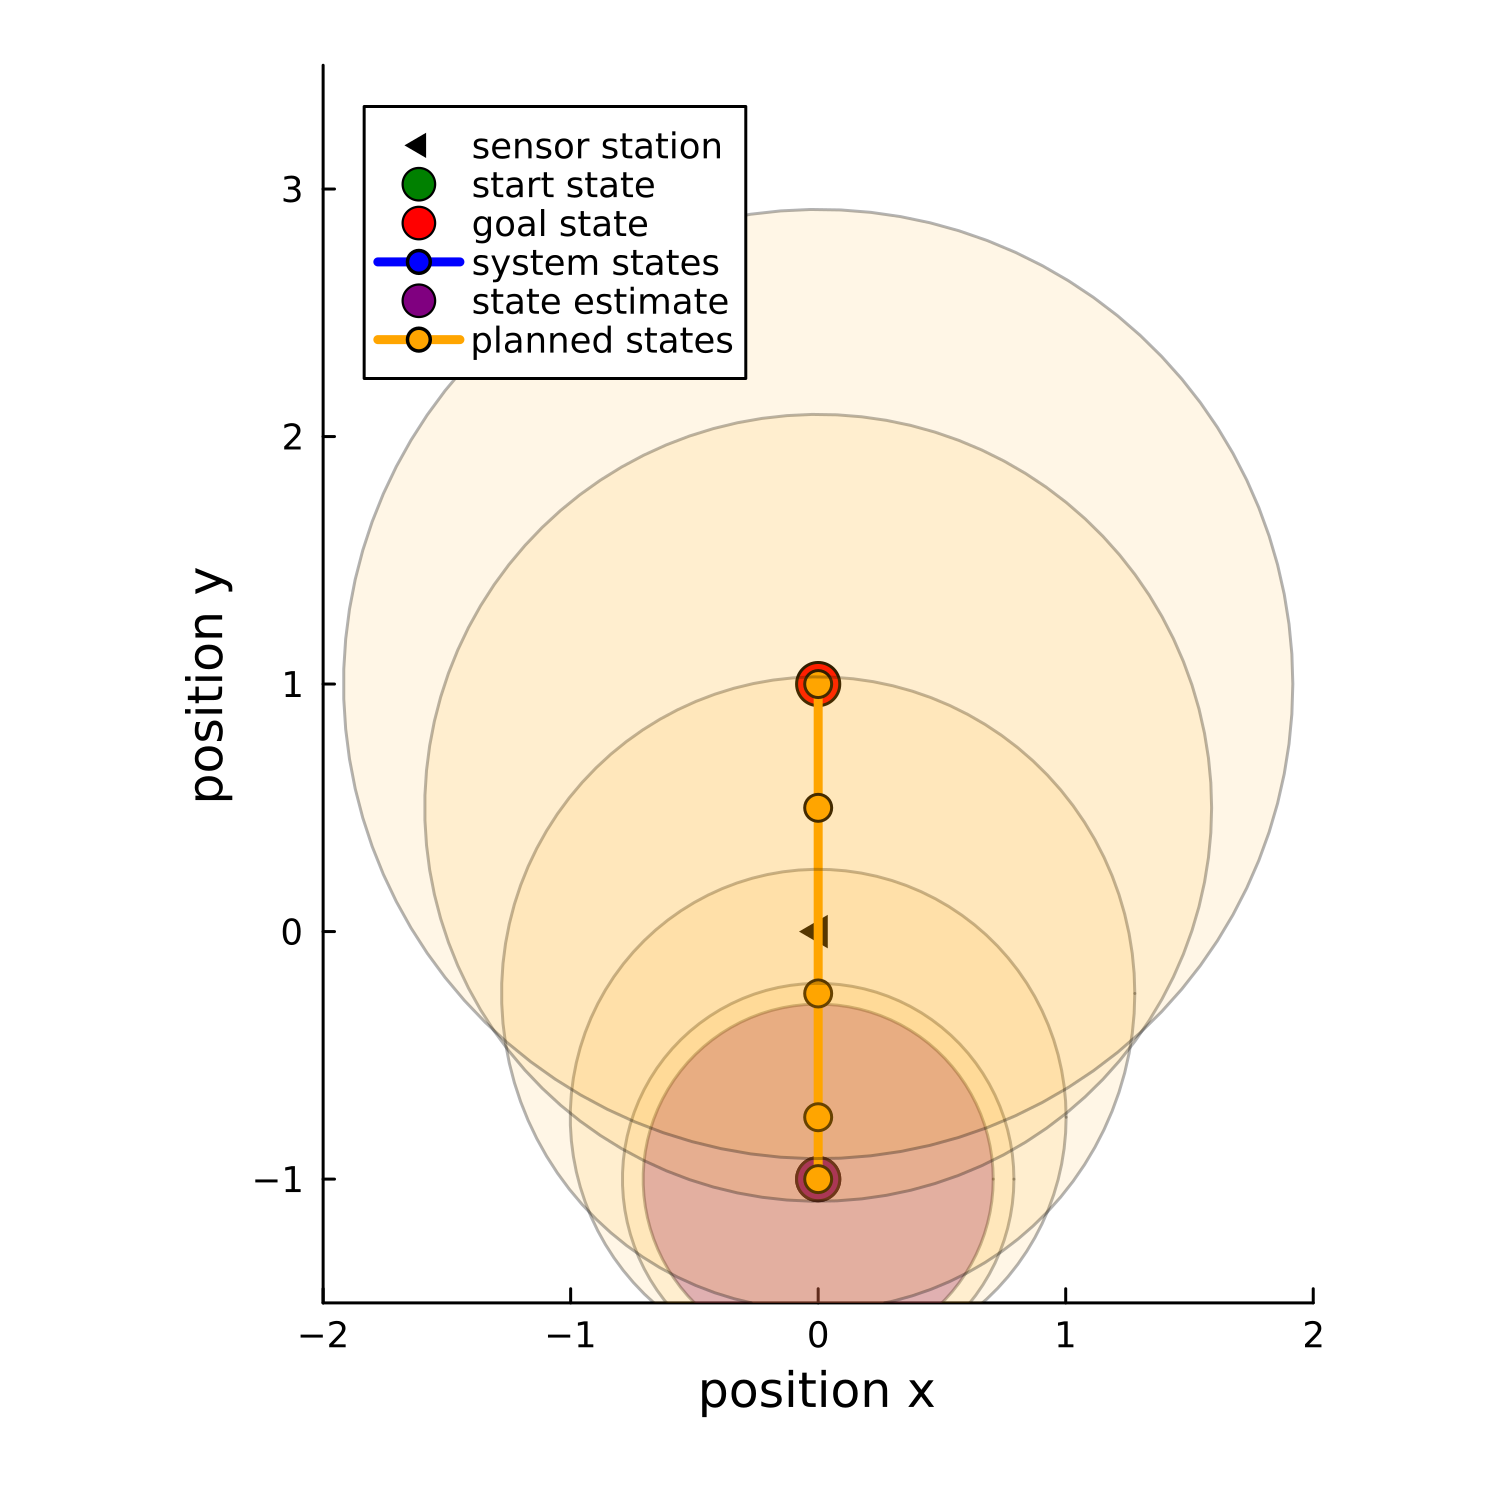
The diagram illustrates a 2D coordinate system (x, y) with labeled axes ranging from -2 to 2 (x-axis) and -1 to 3 (y-axis). It includes concentric circles, colored points, and a legend explaining symbols and colors. The diagram appears to model a robotic or autonomous system's path planning, state estimation, and goal navigation.
### Components/Axes
- **Axes**:
- X-axis: "position x" (range: -2 to 2)
- Y-axis: "position y" (range: -1 to 3)
- **Legend** (top-left corner):
- `▲`: Sensor station
- `●` (green): Start state
- `●` (red): Goal state
- `●` (blue): System states
- `●` (purple): State estimate
- `●` (orange): Planned states
- **Circles**: Concentric shaded regions (lightest to darkest) centered at (0, 0), likely representing uncertainty or coverage areas.
### Detailed Analysis
1. **Sensor Station**:
- Located at (0, 0) (origin), marked with a black triangle (`▲`).
2. **Start State**:
- Green circle at (0, -1), labeled as the initial position.
3. **Goal State**:
- Red circle at (0, 1), marked as the target.
4. **System States**:
- Blue circles along the y-axis at approximate positions:
- (0, -0.5)
- (0, 0)
- (0, 0.5)
- (0, 1)
- These likely represent intermediate positions during navigation.
5. **State Estimate**:
- Purple circle at (0, -0.5), indicating the system's estimated position.
6. **Planned States**:
- Orange circles along the y-axis at:
- (0, -1.5)
- (0, -0.5)
- (0, 0.5)
- (0, 1.5)
- These may represent precomputed waypoints or trajectory points.
### Key Observations
- The system states and planned states are aligned vertically along the y-axis, suggesting a linear path from start to goal.
- The state estimate (purple) is offset from the system states (blue), indicating potential discrepancies between planned and actual positions.
- The concentric circles around the origin (sensor station) imply a radial coverage or uncertainty zone, with darker shades possibly representing higher confidence or smaller regions.
- The goal state (red) is positioned symmetrically above the start state (green) relative to the origin.
### Interpretation
This diagram likely models a robotic system's navigation process:
1. **Path Planning**: The orange "planned states" define a trajectory from the start state (0, -1) to the goal state (0, 1), with intermediate waypoints.
2. **State Estimation**: The purple "state estimate" at (0, -0.5) suggests the system's current position, which may differ from the planned path due to sensor noise or dynamic obstacles.
3. **System States**: The blue circles represent the actual positions recorded during execution, showing progression toward the goal.
4. **Sensor Coverage**: The concentric circles around the origin (sensor station) could represent the robot's sensor range or uncertainty in position estimation. The darkest circle (innermost) might indicate the highest confidence region.
The diagram emphasizes the relationship between planned trajectories, real-time state estimation, and sensor limitations. The offset between planned and estimated states highlights challenges in achieving precise navigation, while the linear alignment of system states suggests a simplified or constrained environment.