## TTS Diagram: RL Base vs. Search Base
### Overview
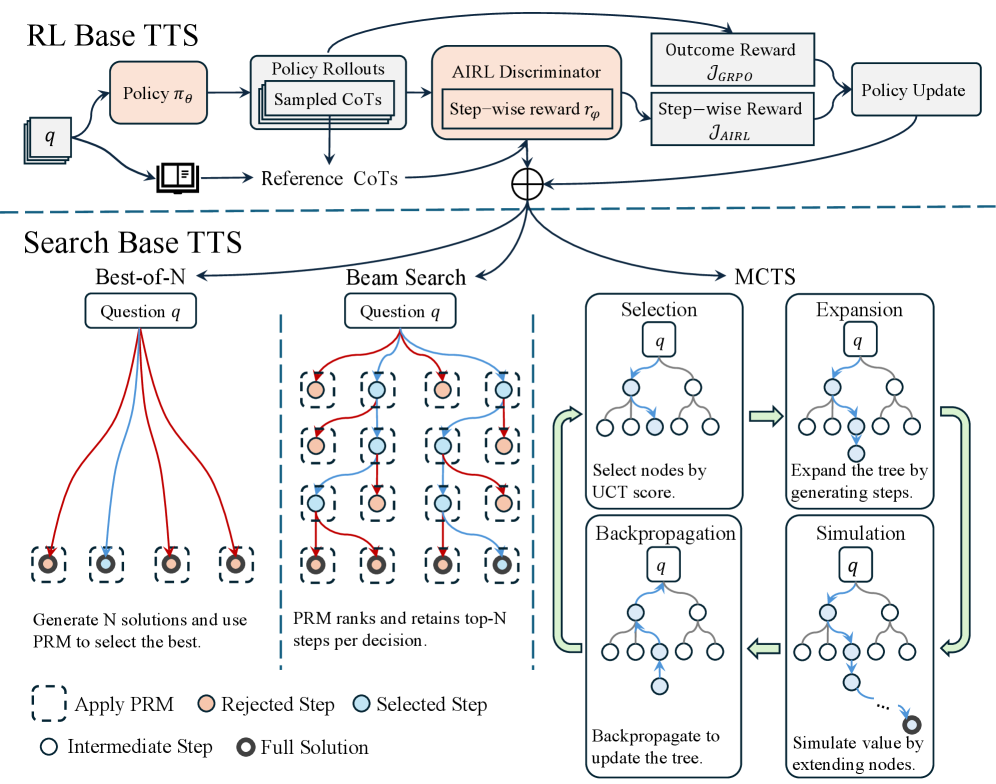
The image presents a diagram comparing two Text-to-Speech (TTS) approaches: RL Base TTS and Search Base TTS. The diagram outlines the processes involved in each approach, including policy rollouts, AIRL discriminator, beam search, and Monte Carlo Tree Search (MCTS).
### Components/Axes
**RL Base TTS (Top Section):**
* **Input:** `q` (unspecified, assumed to be input text or query)
* **Process Flow:**
* `q` feeds into `Policy πθ` (a policy network).
* `Policy πθ` leads to `Policy Rollouts Sampled CoTs` (policy rollouts with sampled chains of thought).
* `Reference CoTs` (reference chains of thought) are also used.
* `Policy Rollouts Sampled CoTs` and `Reference CoTs` feed into `AIRL Discriminator Step-wise reward rφ`.
* `AIRL Discriminator Step-wise reward rφ` outputs `Outcome Reward JGRPO` and `Step-wise Reward JAIRL`.
* `Outcome Reward JGRPO` and `Step-wise Reward JAIRL` lead to `Policy Update`.
* **Elements:**
* Boxes represent processes or components.
* Arrows indicate the flow of data or control.
**Search Base TTS (Bottom Section):**
* **Sub-sections:** Best-of-N, Beam Search, MCTS
* **Best-of-N:**
* **Input:** `Question q`
* **Process:** Generates N solutions and uses PRM (Policy Ranking Model) to select the best.
* **Visual Representation:** Several lines (red and blue) connect the `Question q` box to a series of dashed-line boxes, each containing a circle.
* **Beam Search:**
* **Input:** `Question q`
* **Process:** PRM ranks and retains top-N steps per decision.
* **Visual Representation:** A grid of dashed-line boxes, each containing a circle. Red and blue lines connect the boxes, representing the search path.
* **MCTS:**
* **Process:** A cyclical process involving Selection, Expansion, Simulation, and Backpropagation.
* **Selection:** Select nodes by UCT (Upper Confidence Bound 1 applied to Trees) score.
* **Expansion:** Expand the tree by generating steps.
* **Simulation:** Simulate value by extending nodes.
* **Backpropagation:** Backpropagate to update the tree.
* **Visual Representation:** Tree structures within each stage, with arrows indicating the flow of the MCTS cycle.
**Legend (Bottom):**
* `Apply PRM`: Dashed-line box
* `Rejected Step`: Orange circle
* `Selected Step`: Blue circle
* `Intermediate Step`: White circle
* `Full Solution`: Dark gray circle
### Detailed Analysis or ### Content Details
**RL Base TTS:**
* The process starts with an input `q` and uses a policy network `πθ` to generate rollouts.
* An AIRL discriminator evaluates the rollouts and provides rewards.
* These rewards are used to update the policy.
**Search Base TTS:**
* **Best-of-N:** Multiple solutions are generated, and PRM selects the best one. The lines connecting the question to the solutions are both red and blue, indicating both rejected and selected steps.
* **Beam Search:** A beam search algorithm is used to explore possible solutions, with PRM ranking and retaining the top-N steps. The grid shows a series of steps, with orange circles indicating rejected steps and blue circles indicating selected steps.
* **MCTS:** The MCTS process iteratively selects, expands, simulates, and backpropagates to build a search tree.
* **Selection:** Nodes are selected based on their UCT score.
* **Expansion:** The tree is expanded by generating new steps.
* **Simulation:** The value of the tree is estimated by simulating further steps.
* **Backpropagation:** The results of the simulation are used to update the values of the nodes in the tree.
### Key Observations
* The RL Base TTS approach uses a policy network and an AIRL discriminator to learn a policy for generating speech.
* The Search Base TTS approach uses a combination of Best-of-N, Beam Search, and MCTS to search for the best possible solution.
* The MCTS process is cyclical, with each stage building upon the previous one.
### Interpretation
The diagram illustrates two distinct approaches to Text-to-Speech synthesis. The RL Base TTS leverages reinforcement learning to optimize a policy for generating speech, while the Search Base TTS employs search algorithms to find the best possible solution from a set of candidates. The diagram highlights the key components and processes involved in each approach, providing a visual comparison of their methodologies. The use of PRM in the Search Base TTS suggests a learned ranking model is used to guide the search process. The MCTS component indicates a tree-based search strategy, allowing for exploration and exploitation of different solution paths.