## Line Chart: LongBench Accuracy vs KV Cache Size (Dataset: Lcc)
### Overview
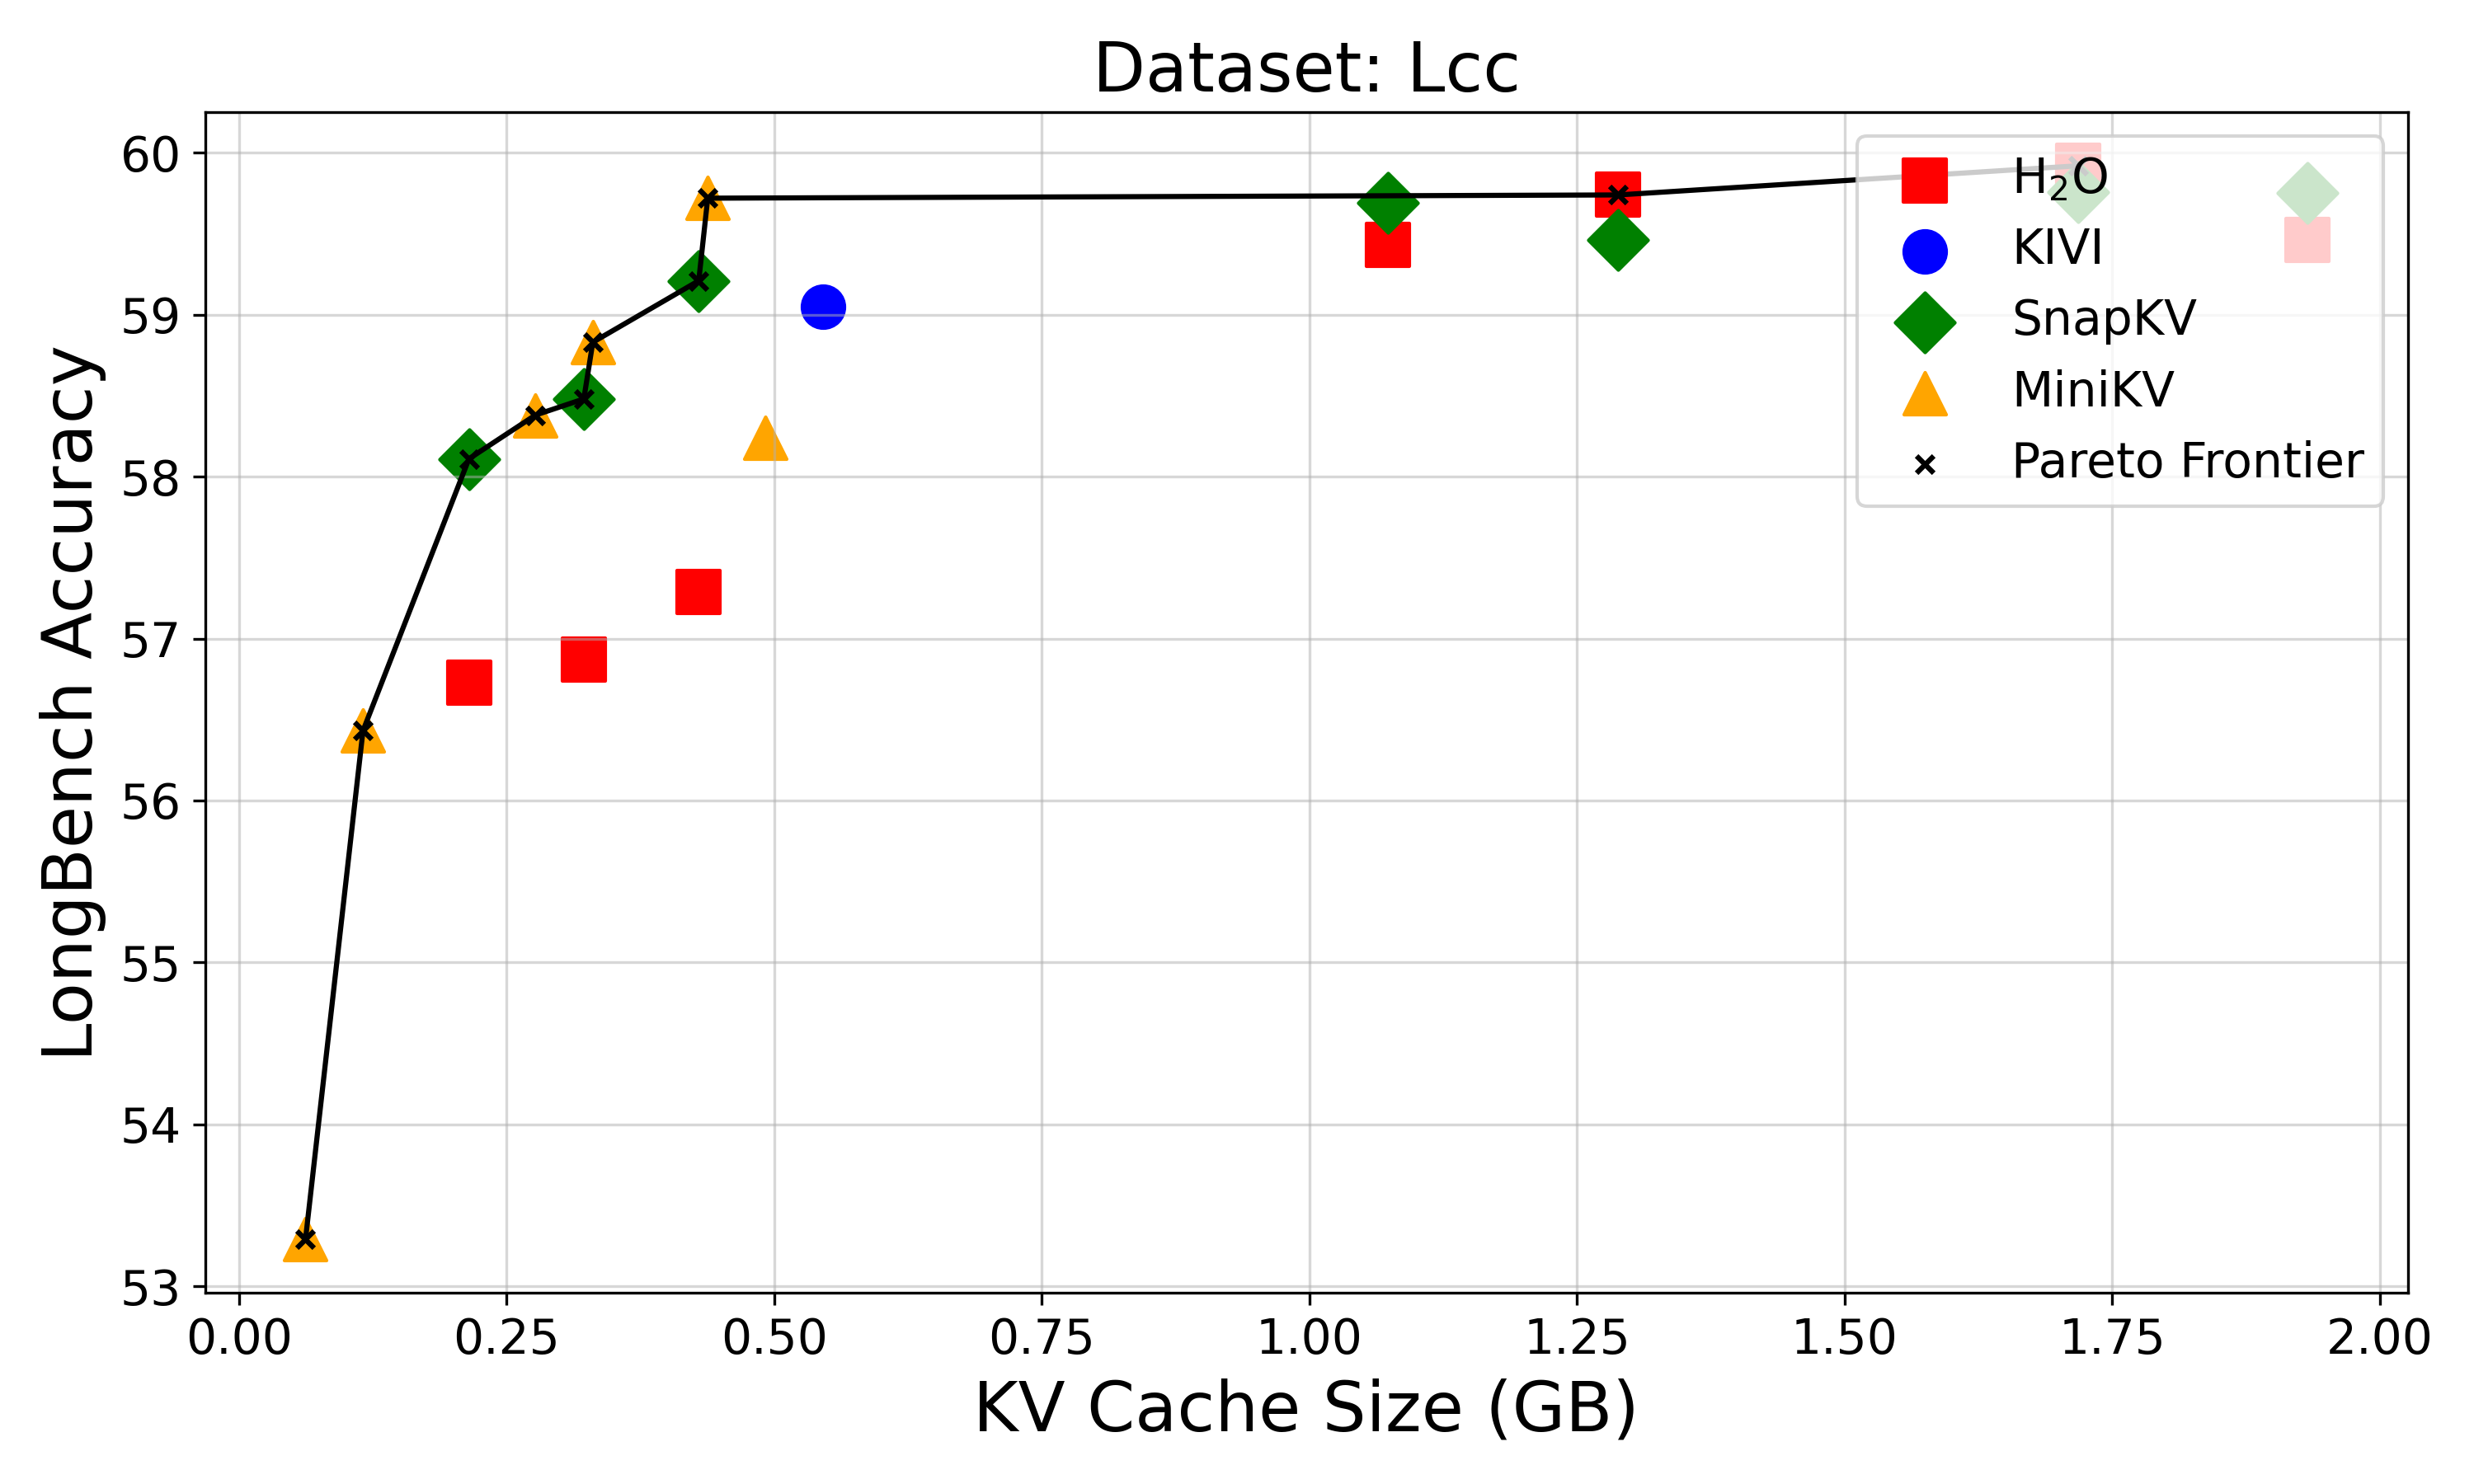
The chart illustrates the relationship between KV Cache Size (in GB) and LongBench Accuracy for multiple algorithms (H₂O, KIVI, SnapKV, MiniKV) and a Pareto Frontier. Data points are plotted with distinct markers and colors, showing performance trends across cache sizes from 0.00 to 2.00 GB.
### Components/Axes
- **X-Axis**: KV Cache Size (GB), ranging from 0.00 to 2.00 in increments of 0.25 GB.
- **Y-Axis**: LongBench Accuracy, ranging from 53 to 60 in increments of 1.
- **Legend**: Located in the top-right corner, mapping colors/markers to algorithms:
- Red squares: H₂O
- Blue circle: KIVI
- Green diamonds: SnapKV
- Yellow triangles: MiniKV
- Black line with "x" markers: Pareto Frontier
### Detailed Analysis
1. **H₂O (Red Squares)**:
- Data points at:
- 0.25 GB: ~57.0
- 0.5 GB: ~57.5
- 1.0 GB: ~58.5
- 1.25 GB: ~59.0
- 1.75 GB: ~59.5
- **Trend**: Steady upward slope with minimal fluctuations.
2. **KIVI (Blue Circle)**:
- Single data point at:
- 0.5 GB: ~59.0
- **Trend**: Isolated point; no clear trend due to limited data.
3. **SnapKV (Green Diamonds)**:
- Data points at:
- 0.25 GB: ~58.2
- 0.5 GB: ~59.2
- 1.0 GB: ~59.7
- 1.25 GB: ~59.5
- 1.75 GB: ~59.8
- **Trend**: Sharp increase until 1.0 GB, followed by a slight dip and recovery.
4. **MiniKV (Yellow Triangles)**:
- Data points at:
- 0.125 GB: ~56.5
- 0.25 GB: ~58.5
- 0.5 GB: ~58.2
- 1.0 GB: ~59.5
- 1.75 GB: ~59.7
- **Trend**: Initial dip at 0.5 GB, then consistent growth.
5. **Pareto Frontier (Black Line)**:
- Connects points from:
- 0.125 GB: ~56.5
- 0.25 GB: ~58.5
- 0.5 GB: ~59.2
- 1.0 GB: ~59.7
- 1.25 GB: ~59.5
- 1.75 GB: ~59.8
- **Trend**: Overall upward trajectory with a minor dip at 1.25 GB.
### Key Observations
- **H₂O** and **MiniKV** show consistent improvements with larger cache sizes.
- **SnapKV** peaks at 1.0 GB before a minor decline, suggesting potential inefficiency at higher cache sizes.
- **MiniKV** exhibits a temporary drop at 0.5 GB, possibly indicating optimization challenges.
- The **Pareto Frontier** highlights the theoretical maximum accuracy achievable for each cache size, with deviations (e.g., SnapKV at 1.25 GB) indicating suboptimal performance.
### Interpretation
The chart demonstrates that larger KV cache sizes generally correlate with higher LongBench Accuracy, but efficiency varies by algorithm. The Pareto Frontier serves as a benchmark, revealing that some algorithms (e.g., SnapKV at 1.25 GB) underperform relative to their theoretical potential. H₂O and MiniKV align closely with the frontier, suggesting they are optimized for cache utilization. KIVI’s single data point at 0.5 GB may represent a specialized use case or outlier. The trends underscore the trade-off between resource allocation (cache size) and performance gains, with diminishing returns observed as cache size increases.