## Line Chart: Similarity vs. Reasoning Step for Various Language Models
### Overview
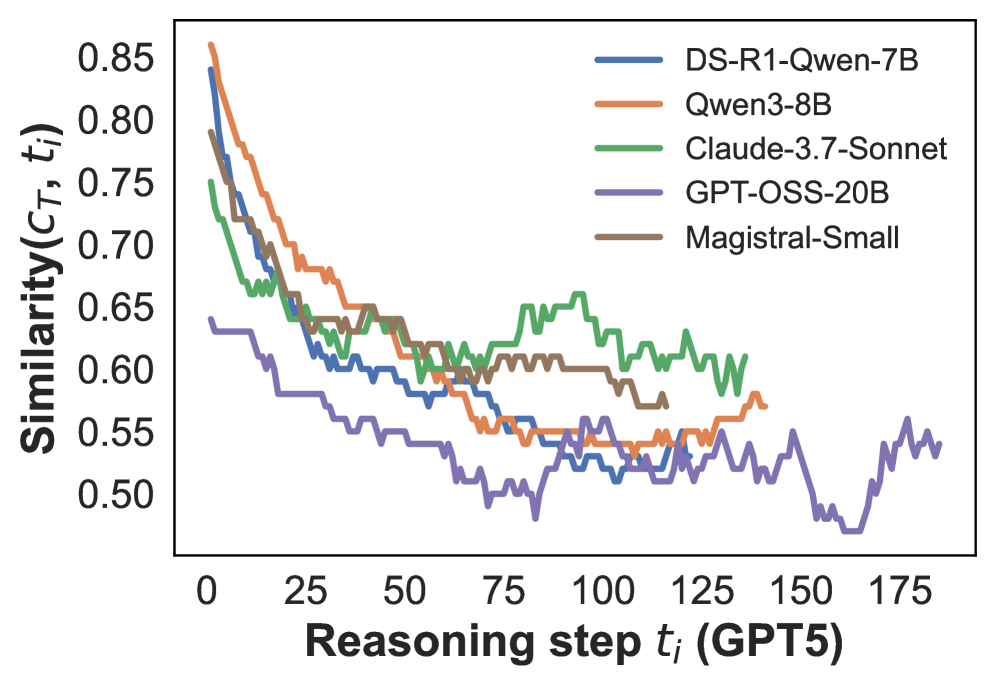
The image is a line chart comparing the similarity scores of different language models (DS-R1-Qwen-7B, Qwen3-8B, Claude-3.7-Sonnet, GPT-OSS-20B, and Magistral-Small) over a series of reasoning steps. The x-axis represents the reasoning step, and the y-axis represents the similarity score.
### Components/Axes
* **X-axis:** Reasoning step *t<sub>i</sub>* (GPT5). Scale ranges from 0 to 175, with tick marks at intervals of 25.
* **Y-axis:** Similarity(*C<sub>T</sub>*, *t<sub>i</sub>*). Scale ranges from 0.50 to 0.85, with tick marks at intervals of 0.05.
* **Legend:** Located at the top-right of the chart.
* Blue: DS-R1-Qwen-7B
* Orange: Qwen3-8B
* Green: Claude-3.7-Sonnet
* Purple: GPT-OSS-20B
* Brown: Magistral-Small
### Detailed Analysis
* **DS-R1-Qwen-7B (Blue):** Starts at approximately 0.85 and generally decreases to around 0.55 by the end of the reasoning steps. The line shows a decreasing trend with some fluctuations.
* At step 0, the similarity is approximately 0.85.
* At step 25, the similarity is approximately 0.70.
* At step 175, the similarity is approximately 0.55.
* **Qwen3-8B (Orange):** Starts at approximately 0.85 and decreases to around 0.57 by the end of the reasoning steps. The line shows a decreasing trend with some fluctuations.
* At step 0, the similarity is approximately 0.85.
* At step 25, the similarity is approximately 0.72.
* At step 175, the similarity is approximately 0.57.
* **Claude-3.7-Sonnet (Green):** Starts at approximately 0.75 and fluctuates between 0.55 and 0.65 after step 50.
* At step 0, the similarity is approximately 0.75.
* At step 25, the similarity is approximately 0.68.
* At step 175, the similarity is approximately 0.57.
* **GPT-OSS-20B (Purple):** Starts at approximately 0.63 and decreases to around 0.50 by the end of the reasoning steps. The line shows a decreasing trend with significant fluctuations.
* At step 0, the similarity is approximately 0.63.
* At step 25, the similarity is approximately 0.58.
* At step 175, the similarity is approximately 0.53.
* **Magistral-Small (Brown):** Starts at approximately 0.75 and fluctuates between 0.57 and 0.62 after step 50.
* At step 0, the similarity is approximately 0.75.
* At step 25, the similarity is approximately 0.68.
* At step 175, the similarity is approximately 0.58.
### Key Observations
* The models DS-R1-Qwen-7B and Qwen3-8B start with the highest similarity scores.
* GPT-OSS-20B consistently has the lowest similarity scores throughout the reasoning steps.
* All models show a decrease in similarity as the reasoning step increases, especially in the initial steps.
* Claude-3.7-Sonnet and Magistral-Small exhibit more stable similarity scores after the initial drop.
### Interpretation
The chart illustrates how the similarity of language models changes over a series of reasoning steps. The decreasing trend in similarity suggests that as the models perform more reasoning steps, their responses become less similar to the initial context or target. The differences in the starting points and the rates of decline indicate variations in the models' ability to maintain consistency and relevance during extended reasoning processes. GPT-OSS-20B's lower similarity scores may indicate a weaker ability to maintain coherence or relevance compared to the other models. The stabilization of Claude-3.7-Sonnet and Magistral-Small after the initial drop suggests that these models might have a mechanism to maintain a certain level of similarity even with increasing reasoning steps.