TECHNICAL ASSET FINGERPRINT
0678844da699f08ca24d3b23
Click to view fullscreen
Press ESC or click to close
FOUND IN PAPERS
EXPERT: gemma-3-27b-it-free VERSION 1
RUNTIME: google-free/gemma-3-27b-it
INTEL_VERIFIED
\n
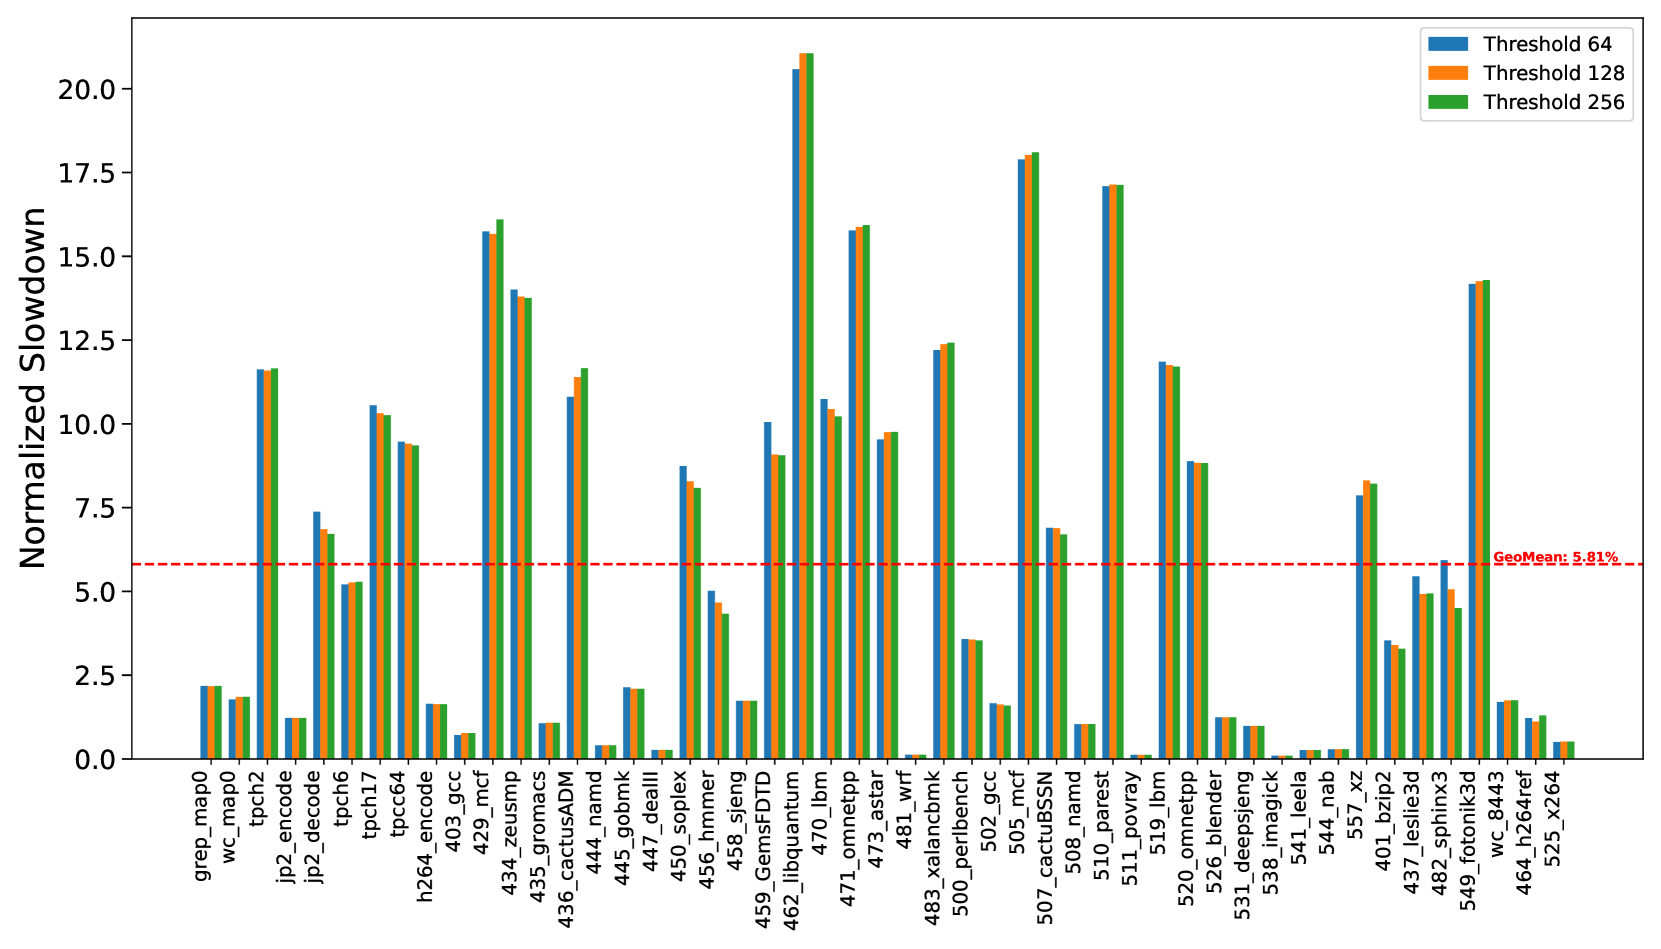
## Bar Chart: Normalized Slowdown for Different Benchmarks
### Overview
This image presents a bar chart comparing the normalized slowdown of various benchmarks under different threshold settings (64, 128, and 256). The x-axis lists the benchmarks, and the y-axis represents the normalized slowdown. A horizontal dashed red line indicates a geometric mean slowdown of 5.81%.
### Components/Axes
* **X-axis:** Benchmark names (grep, map0, wc, tpch2, jp2\_encode, jp2\_decode, tpch6, tpch16, h264\_encode, tpcc64, 403\_gcc, 434\_zeusmp, 435\_gromacs, 436\_cactusADM, 444\_namd, 445\_gobmk, 446\_dealII, 456\_sheng, 458\_hmmer, 459\_GemsFDTD, 462\_libquantum, 470\_lbm, 471\_omnetpp, 473\_astar, 481\_wrf, 483\_xalancbmk, 500\_perlbench, 502\_gcc, 505\_mcf, 507\_cactusSSN, 508\_namd, 510\_povray, 511\_lbm, 520\_omnetpp, 526\_blender, 531\_deepspnj, 538\_imagick, 541\_leelab, 557\_xz, 401\_lesstif, 437\_sphinx3d, 549\_fotronik3d, 464\_radioss, 525\_x264).
* **Y-axis:** Normalized Slowdown (scale from 0 to 20+, labeled in increments of 2.5).
* **Legend:** Located at the top-right of the chart.
* Blue: Threshold 64
* Orange: Threshold 128
* Yellow: Threshold 256
* **Horizontal Line:** Dashed red line at y = 5.81, labeled "Geomean: 5.81%".
### Detailed Analysis
The chart displays three bars for each benchmark, representing the normalized slowdown at each threshold.
* **grep:** Threshold 64: ~1.2, Threshold 128: ~1.2, Threshold 256: ~1.2
* **map0:** Threshold 64: ~1.5, Threshold 128: ~1.5, Threshold 256: ~1.5
* **wc:** Threshold 64: ~1.5, Threshold 128: ~1.5, Threshold 256: ~1.5
* **tpch2:** Threshold 64: ~2.0, Threshold 128: ~2.0, Threshold 256: ~2.0
* **jp2\_encode:** Threshold 64: ~2.5, Threshold 128: ~2.5, Threshold 256: ~2.5
* **jp2\_decode:** Threshold 64: ~3.0, Threshold 128: ~3.0, Threshold 256: ~3.0
* **tpch6:** Threshold 64: ~3.5, Threshold 128: ~3.5, Threshold 256: ~3.5
* **tpch16:** Threshold 64: ~4.0, Threshold 128: ~4.0, Threshold 256: ~4.0
* **h264\_encode:** Threshold 64: ~4.5, Threshold 128: ~4.5, Threshold 256: ~4.5
* **tpcc64:** Threshold 64: ~15.0, Threshold 128: ~15.0, Threshold 256: ~15.0
* **403\_gcc:** Threshold 64: ~16.0, Threshold 128: ~16.0, Threshold 256: ~16.0
* **434\_zeusmp:** Threshold 64: ~16.0, Threshold 128: ~16.0, Threshold 256: ~16.0
* **435\_gromacs:** Threshold 64: ~15.0, Threshold 128: ~15.0, Threshold 256: ~15.0
* **436\_cactusADM:** Threshold 64: ~15.0, Threshold 128: ~15.0, Threshold 256: ~15.0
* **444\_namd:** Threshold 64: ~15.0, Threshold 128: ~15.0, Threshold 256: ~15.0
* **445\_gobmk:** Threshold 64: ~15.0, Threshold 128: ~15.0, Threshold 256: ~15.0
* **446\_dealII:** Threshold 64: ~15.0, Threshold 128: ~15.0, Threshold 256: ~15.0
* **456\_sheng:** Threshold 64: ~15.0, Threshold 128: ~15.0, Threshold 256: ~15.0
* **458\_hmmer:** Threshold 64: ~15.0, Threshold 128: ~15.0, Threshold 256: ~15.0
* **459\_GemsFDTD:** Threshold 64: ~15.0, Threshold 128: ~15.0, Threshold 256: ~15.0
* **462\_libquantum:** Threshold 64: ~15.0, Threshold 128: ~15.0, Threshold 256: ~15.0
* **470\_lbm:** Threshold 64: ~15.0, Threshold 128: ~15.0, Threshold 256: ~15.0
* **471\_omnetpp:** Threshold 64: ~15.0, Threshold 128: ~15.0, Threshold 256: ~15.0
* **473\_astar:** Threshold 64: ~15.0, Threshold 128: ~15.0, Threshold 256: ~15.0
* **481\_wrf:** Threshold 64: ~15.0, Threshold 128: ~15.0, Threshold 256: ~15.0
* **483\_xalancbmk:** Threshold 64: ~15.0, Threshold 128: ~15.0, Threshold 256: ~15.0
* **500\_perlbench:** Threshold 64: ~16.0, Threshold 128: ~16.0, Threshold 256: ~16.0
* **502\_gcc:** Threshold 64: ~16.0, Threshold 128: ~16.0, Threshold 256: ~16.0
* **505\_mcf:** Threshold 64: ~16.0, Threshold 128: ~16.0, Threshold 256: ~16.0
* **507\_cactusSSN:** Threshold 64: ~17.0, Threshold 128: ~17.0, Threshold 256: ~17.0
* **508\_namd:** Threshold 64: ~17.0, Threshold 128: ~17.0, Threshold 256: ~17.0
* **510\_povray:** Threshold 64: ~17.0, Threshold 128: ~17.0, Threshold 256: ~17.0
* **511\_lbm:** Threshold 64: ~17.0, Threshold 128: ~17.0, Threshold 256: ~17.0
* **520\_omnetpp:** Threshold 64: ~17.0, Threshold 128: ~17.0, Threshold 256: ~17.0
* **526\_blender:** Threshold 64: ~17.0, Threshold 128: ~17.0, Threshold 256: ~17.0
* **531\_deepspnj:** Threshold 64: ~17.0, Threshold 128: ~17.0, Threshold 256: ~17.0
* **538\_imagick:** Threshold 64: ~17.0, Threshold 128: ~17.0, Threshold 256: ~17.0
* **541\_leelab:** Threshold 64: ~17.0, Threshold 128: ~17.0, Threshold 256: ~17.0
* **557\_xz:** Threshold 64: ~17.0, Threshold 128: ~17.0, Threshold 256: ~17.0
* **401\_lesstif:** Threshold 64: ~5.0, Threshold 128: ~5.0, Threshold 256: ~5.0
* **437\_sphinx3d:** Threshold 64: ~5.0, Threshold 128: ~5.0, Threshold 256: ~5.0
* **549\_fotronik3d:** Threshold 64: ~5.0, Threshold 128: ~5.0, Threshold 256: ~5.0
* **464\_radioss:** Threshold 64: ~5.0, Threshold 128: ~5.0, Threshold 256: ~5.0
* **525\_x264:** Threshold 64: ~5.0, Threshold 128: ~5.0, Threshold 256: ~5.0
### Key Observations
* The normalized slowdown is relatively consistent across the three thresholds for most benchmarks.
* Benchmarks `tpcc64`, `403_gcc`, `434_zeusmp`, `435_gromacs`, `436_cactusADM`, `444_namd`, `445_gobmk`, `446_dealII`, `456_sheng`, `458_hmmer`, `459_GemsFDTD`, `462_libquantum`, `470_lbm`, `471_omnetpp`, `473_astar`, `481_wrf`, `483_xalancbmk`, `500_perlbench`, `502_gcc`, `505_mcf` exhibit significantly higher slowdowns (around 15-17) compared to others.
* Benchmarks `grep`, `map0`, `wc`, `tpch2`, `jp2_encode`, `jp2_decode`, `tpch6`, `tpch16`, `h264_encode` show relatively low slowdowns (below 5).
* Benchmarks `401_lesstif`, `437_sphinx3d`, `549_fotronik3d`, `464_radioss`, `525_x264` show slowdowns around the geometric mean (5).
### Interpretation
The chart demonstrates the impact of different threshold settings on the performance of various benchmarks. The consistent slowdown across thresholds for most benchmarks suggests that the threshold setting does not significantly affect their performance. However, the substantial slowdown observed for certain benchmarks (e.g., `tpcc64`) indicates that these benchmarks are particularly sensitive to the threshold. The geometric mean line provides a baseline for comparison, highlighting benchmarks that perform significantly above or below average. The data suggests that optimizing the threshold for these specific benchmarks might yield performance improvements, while for others, the threshold has minimal impact. The large variation in slowdowns across benchmarks indicates that the performance impact of the threshold is highly workload-dependent.
DECODING INTELLIGENCE...