## Scatter Plot: Cognitive Task Distribution in PC Space
### Overview
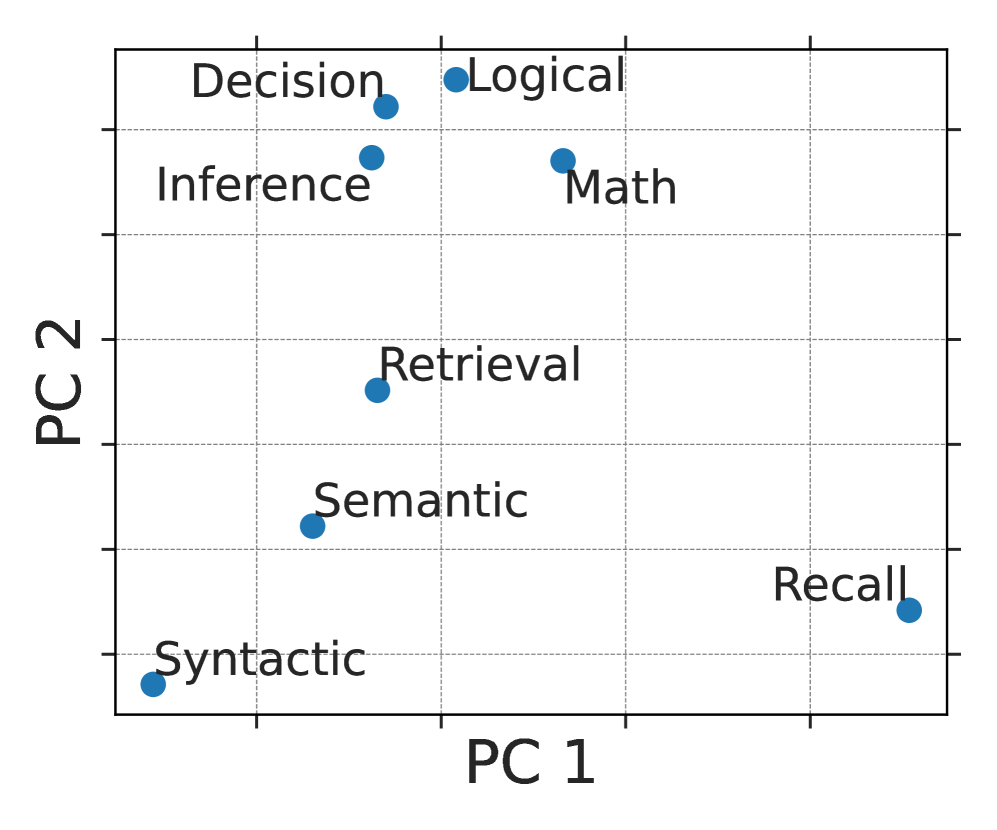
The image is a scatter plot displaying the distribution of various cognitive tasks in a two-dimensional space defined by Principal Component 1 (PC1) and Principal Component 2 (PC2). Each task is represented by a blue dot, with its position indicating its loading on the two principal components. The plot provides a visual representation of the relationships between these tasks based on their underlying cognitive demands.
### Components/Axes
* **X-axis:** PC 1 (Principal Component 1)
* **Y-axis:** PC 2 (Principal Component 2)
* **Data Points:** Blue dots representing cognitive tasks.
* **Gridlines:** Dashed grey lines forming a grid.
* **Cognitive Tasks:**
* Syntactic
* Semantic
* Retrieval
* Inference
* Decision
* Logical
* Math
* Recall
### Detailed Analysis
The scatter plot shows the following approximate coordinates for each cognitive task:
* **Syntactic:** PC1 ~ 0.2, PC2 ~ 0.2
* **Semantic:** PC1 ~ 0.4, PC2 ~ 0.4
* **Retrieval:** PC1 ~ 0.5, PC2 ~ 0.6
* **Inference:** PC1 ~ 0.3, PC2 ~ 0.8
* **Decision:** PC1 ~ 0.4, PC2 ~ 0.9
* **Logical:** PC1 ~ 0.7, PC2 ~ 0.9
* **Math:** PC1 ~ 0.8, PC2 ~ 0.8
* **Recall:** PC1 ~ 0.9, PC2 ~ 0.3
### Key Observations
* The tasks are distributed across the plot, indicating varying degrees of loading on PC1 and PC2.
* "Syntactic" and "Semantic" are clustered together in the bottom-left quadrant.
* "Decision" and "Logical" are clustered together in the top-right quadrant.
* "Recall" is located in the bottom-right quadrant, separated from the other tasks.
### Interpretation
The scatter plot visualizes the relationships between different cognitive tasks based on their underlying cognitive demands, as captured by Principal Component Analysis. The proximity of tasks suggests similarities in their cognitive requirements. For example, "Syntactic" and "Semantic" tasks, being close together, may share common cognitive processes. Conversely, the separation of "Recall" from other tasks suggests it relies on different cognitive mechanisms. The plot provides a simplified representation of the cognitive landscape, highlighting the dimensions along which these tasks differ. The principal components (PC1 and PC2) likely represent underlying cognitive factors that contribute to the performance of these tasks. Further analysis would be needed to determine the specific cognitive processes captured by each principal component.