\n
## Line Chart: Temporal Trends of Nutrient Uptake
### Overview
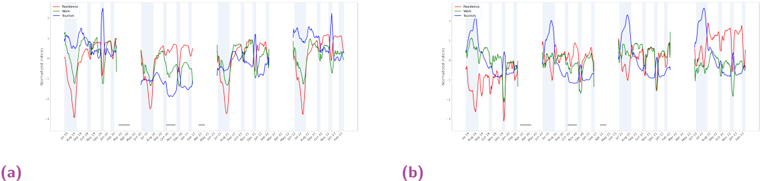
The image presents two line charts, labeled (a) and (b), displaying temporal trends of nutrient uptake. Both charts share the same x-axis representing time points (likely days or weeks) and a y-axis representing "Nutrient Uptake (µM/h)". Each chart plots three nutrient uptake rates: Potassium (K+), Rubidium (Rb+), and Sodium (Na+). The charts are visually similar, with slight variations in the plotted lines. Vertical grey bands are present throughout both charts, likely indicating specific experimental conditions or time periods.
### Components/Axes
* **X-axis:** Labeled "Time (Days)", with tick marks from approximately 0 to 35, incrementing by 5. The labels are slightly angled for readability.
* **Y-axis:** Labeled "Nutrient Uptake (µM/h)", with a scale ranging from approximately 0 to 10, incrementing by 2.
* **Legend:** Located in the top-left corner of each chart.
* Potassium (K+) - Red line
* Rubidium (Rb+) - Green line
* Sodium (Na+) - Blue line
* **Grey Bands:** Vertical bands spanning the entire height of the chart, appearing at regular intervals along the x-axis.
### Detailed Analysis or Content Details
**Chart (a):**
* **Potassium (K+):** The red line starts at approximately 2 µM/h, fluctuates significantly, reaching a peak of around 8 µM/h at day 10, then declines to around 3 µM/h by day 35. There are multiple peaks and troughs throughout the time course.
* **Rubidium (Rb+):** The green line begins at approximately 3 µM/h, exhibits moderate fluctuations, peaking around 6 µM/h at day 5, and ending at approximately 2 µM/h at day 35.
* **Sodium (Na+):** The blue line starts at approximately 5 µM/h, shows substantial oscillations, reaching a maximum of around 9 µM/h at day 10, and decreasing to approximately 4 µM/h at day 35.
**Chart (b):**
* **Potassium (K+):** The red line starts at approximately 2 µM/h, fluctuates significantly, reaching a peak of around 7 µM/h at day 10, then declines to around 3 µM/h by day 35. There are multiple peaks and troughs throughout the time course.
* **Rubidium (Rb+):** The green line begins at approximately 3 µM/h, exhibits moderate fluctuations, peaking around 6 µM/h at day 5, and ending at approximately 2 µM/h at day 35.
* **Sodium (Na+):** The blue line starts at approximately 5 µM/h, shows substantial oscillations, reaching a maximum of around 9 µM/h at day 10, and decreasing to approximately 4 µM/h at day 35.
### Key Observations
* Both charts exhibit similar trends for all three nutrients.
* Sodium (Na+) consistently shows the highest uptake rates and the most pronounced fluctuations.
* Potassium (K+) and Rubidium (Rb+) uptake rates are generally lower and more stable than Sodium (Na+).
* The grey bands do not appear to directly correlate with specific peaks or troughs in nutrient uptake, but they may represent periods of altered experimental conditions.
* The fluctuations in nutrient uptake appear somewhat periodic, with cycles of increasing and decreasing rates.
### Interpretation
The data suggests that the uptake of Sodium, Potassium, and Rubidium varies over time, potentially in response to changing environmental conditions or internal physiological processes. The higher uptake rate and greater variability of Sodium suggest it plays a more dynamic role in the system being studied. The similarity between the two charts (a) and (b) indicates that the observed trends are reproducible or consistent across different experimental runs or conditions. The periodic fluctuations could be related to circadian rhythms, nutrient availability cycles, or other time-dependent factors. The grey bands likely represent experimental manipulations or time points of interest, but their specific meaning requires additional context. The fact that Rubidium uptake is consistently lower than Potassium uptake suggests a difference in transport mechanisms or cellular requirements for these two ions. Further investigation is needed to determine the underlying causes of these observed trends and their biological significance.