## Bar Chart: Probability Distribution over the LLM's Text Tokens
### Overview
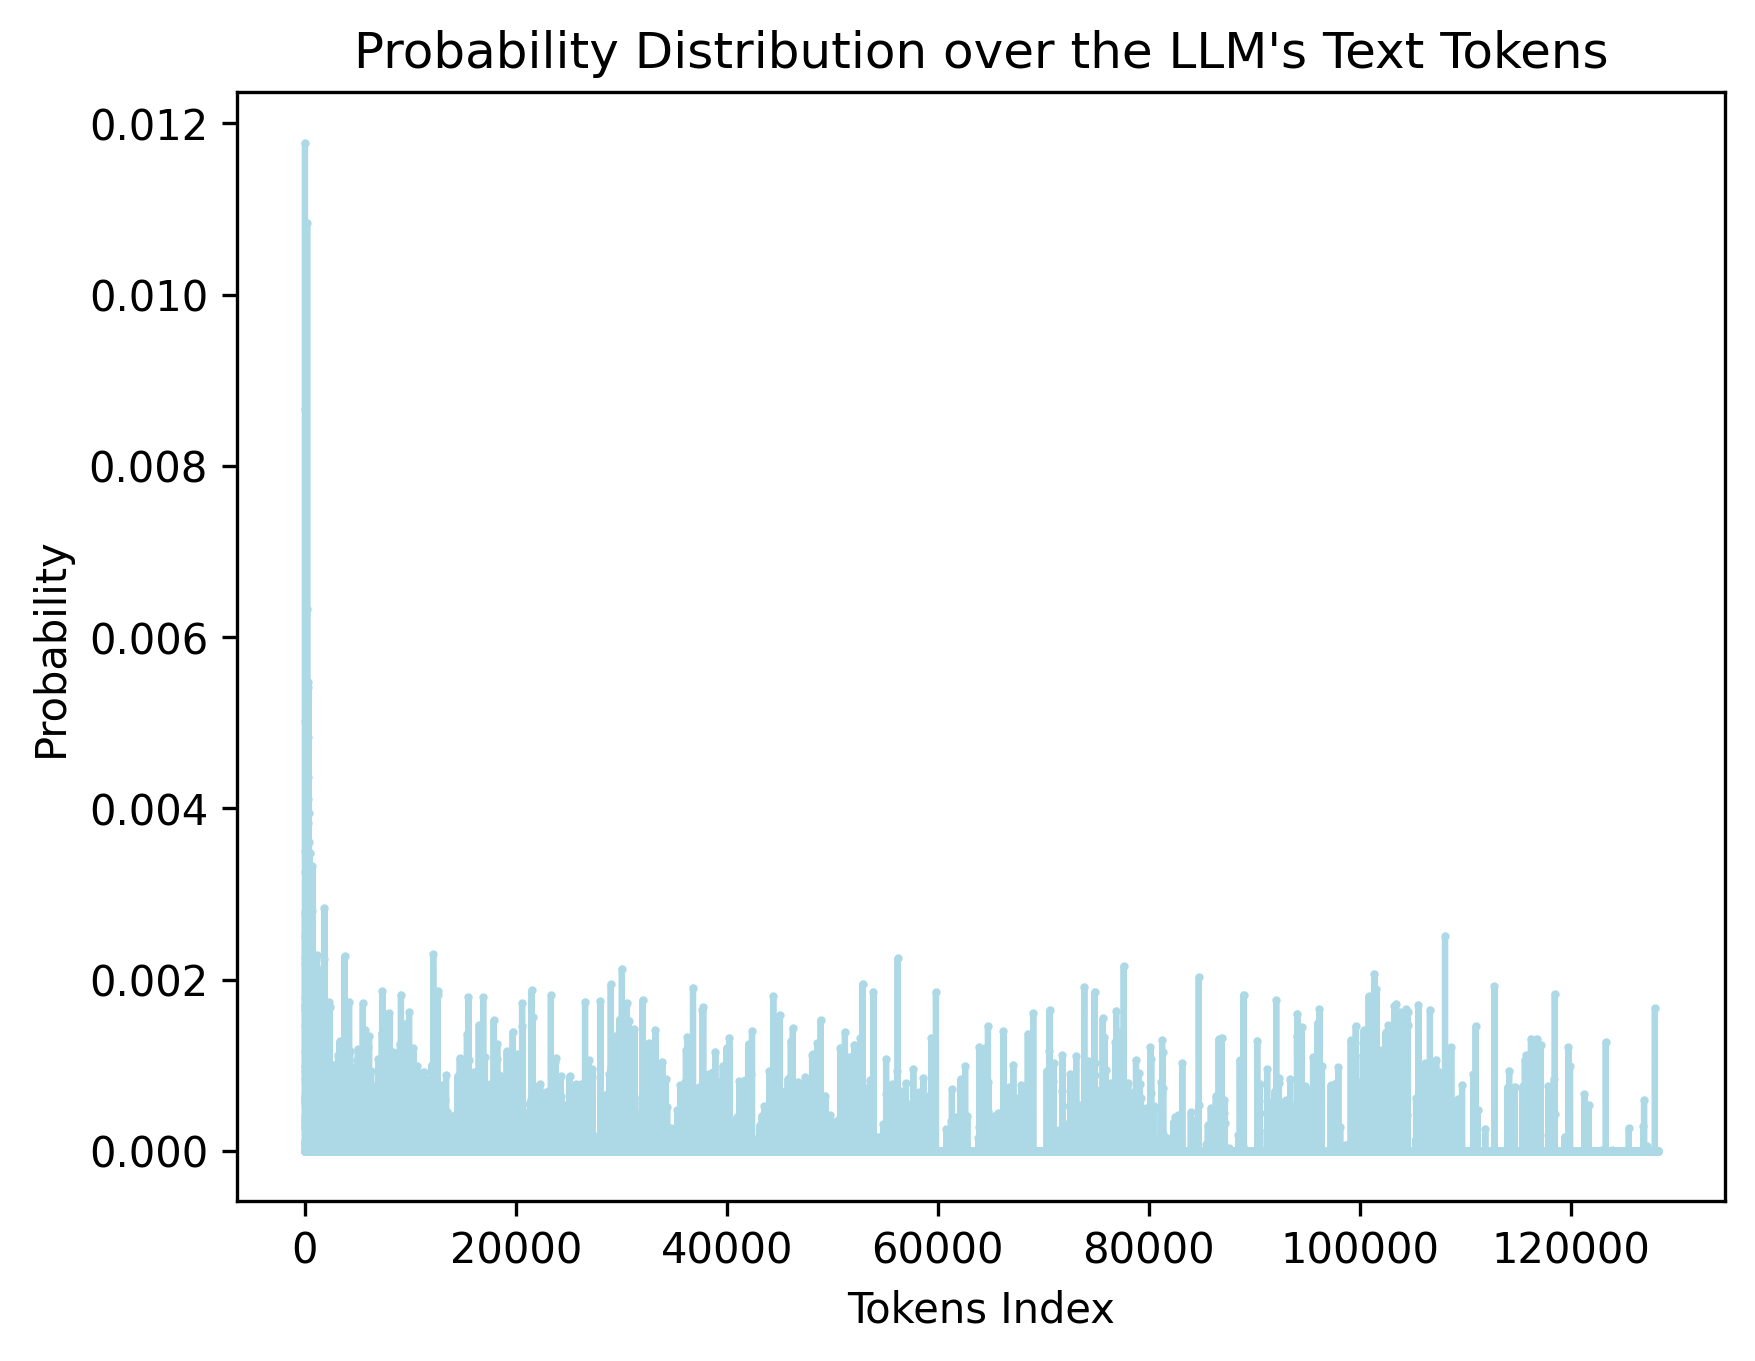
The image is a bar chart illustrating the probability distribution of text tokens within a Large Language Model (LLM). The x-axis represents the token index, and the y-axis represents the probability. The chart shows a high probability for the initial tokens, followed by a rapid decrease and then a relatively stable, low probability distribution across the remaining tokens.
### Components/Axes
* **Title:** Probability Distribution over the LLM's Text Tokens
* **X-axis:** Tokens Index
* Scale: 0 to 120000, with major ticks at 0, 20000, 40000, 60000, 80000, 100000, and 120000.
* **Y-axis:** Probability
* Scale: 0.000 to 0.012, with major ticks at 0.000, 0.002, 0.004, 0.006, 0.008, 0.010, and 0.012.
* **Data Series:** The chart displays a single data series represented by light blue bars.
### Detailed Analysis
* **Initial Tokens:** The probability for the first few tokens is significantly higher, peaking at approximately 0.012.
* **Rapid Decrease:** The probability drops sharply from token index 0 to approximately 10000.
* **Stable Distribution:** Beyond token index 10000, the probability remains relatively low and stable, fluctuating between approximately 0.000 and 0.002.
* **Token Index 0:** The probability at token index 0 is approximately 0.0118.
* **Token Index 20000:** The probability fluctuates around 0.001.
* **Token Index 40000:** The probability fluctuates around 0.001.
* **Token Index 60000:** The probability fluctuates around 0.001.
* **Token Index 80000:** The probability fluctuates around 0.001.
* **Token Index 100000:** The probability fluctuates around 0.001.
* **Token Index 120000:** The probability fluctuates around 0.001.
### Key Observations
* The distribution is highly skewed, with a few tokens having a much higher probability than the rest.
* The initial tokens are likely to be more frequent or important in the LLM's vocabulary.
* The long tail of low-probability tokens suggests a diverse vocabulary.
### Interpretation
The chart illustrates the probability distribution of tokens used by the LLM. The high probability of the initial tokens suggests that these tokens are either very common or play a crucial role in the language model's structure. The rapid decrease in probability indicates that the model's vocabulary contains a large number of less frequent tokens. This distribution is typical for language models, where a small subset of words accounts for a large proportion of the text. The shape of the distribution provides insights into the LLM's vocabulary and token usage patterns.