## Scatter Plot: Language Model Performance vs. Decoding Speed
### Overview
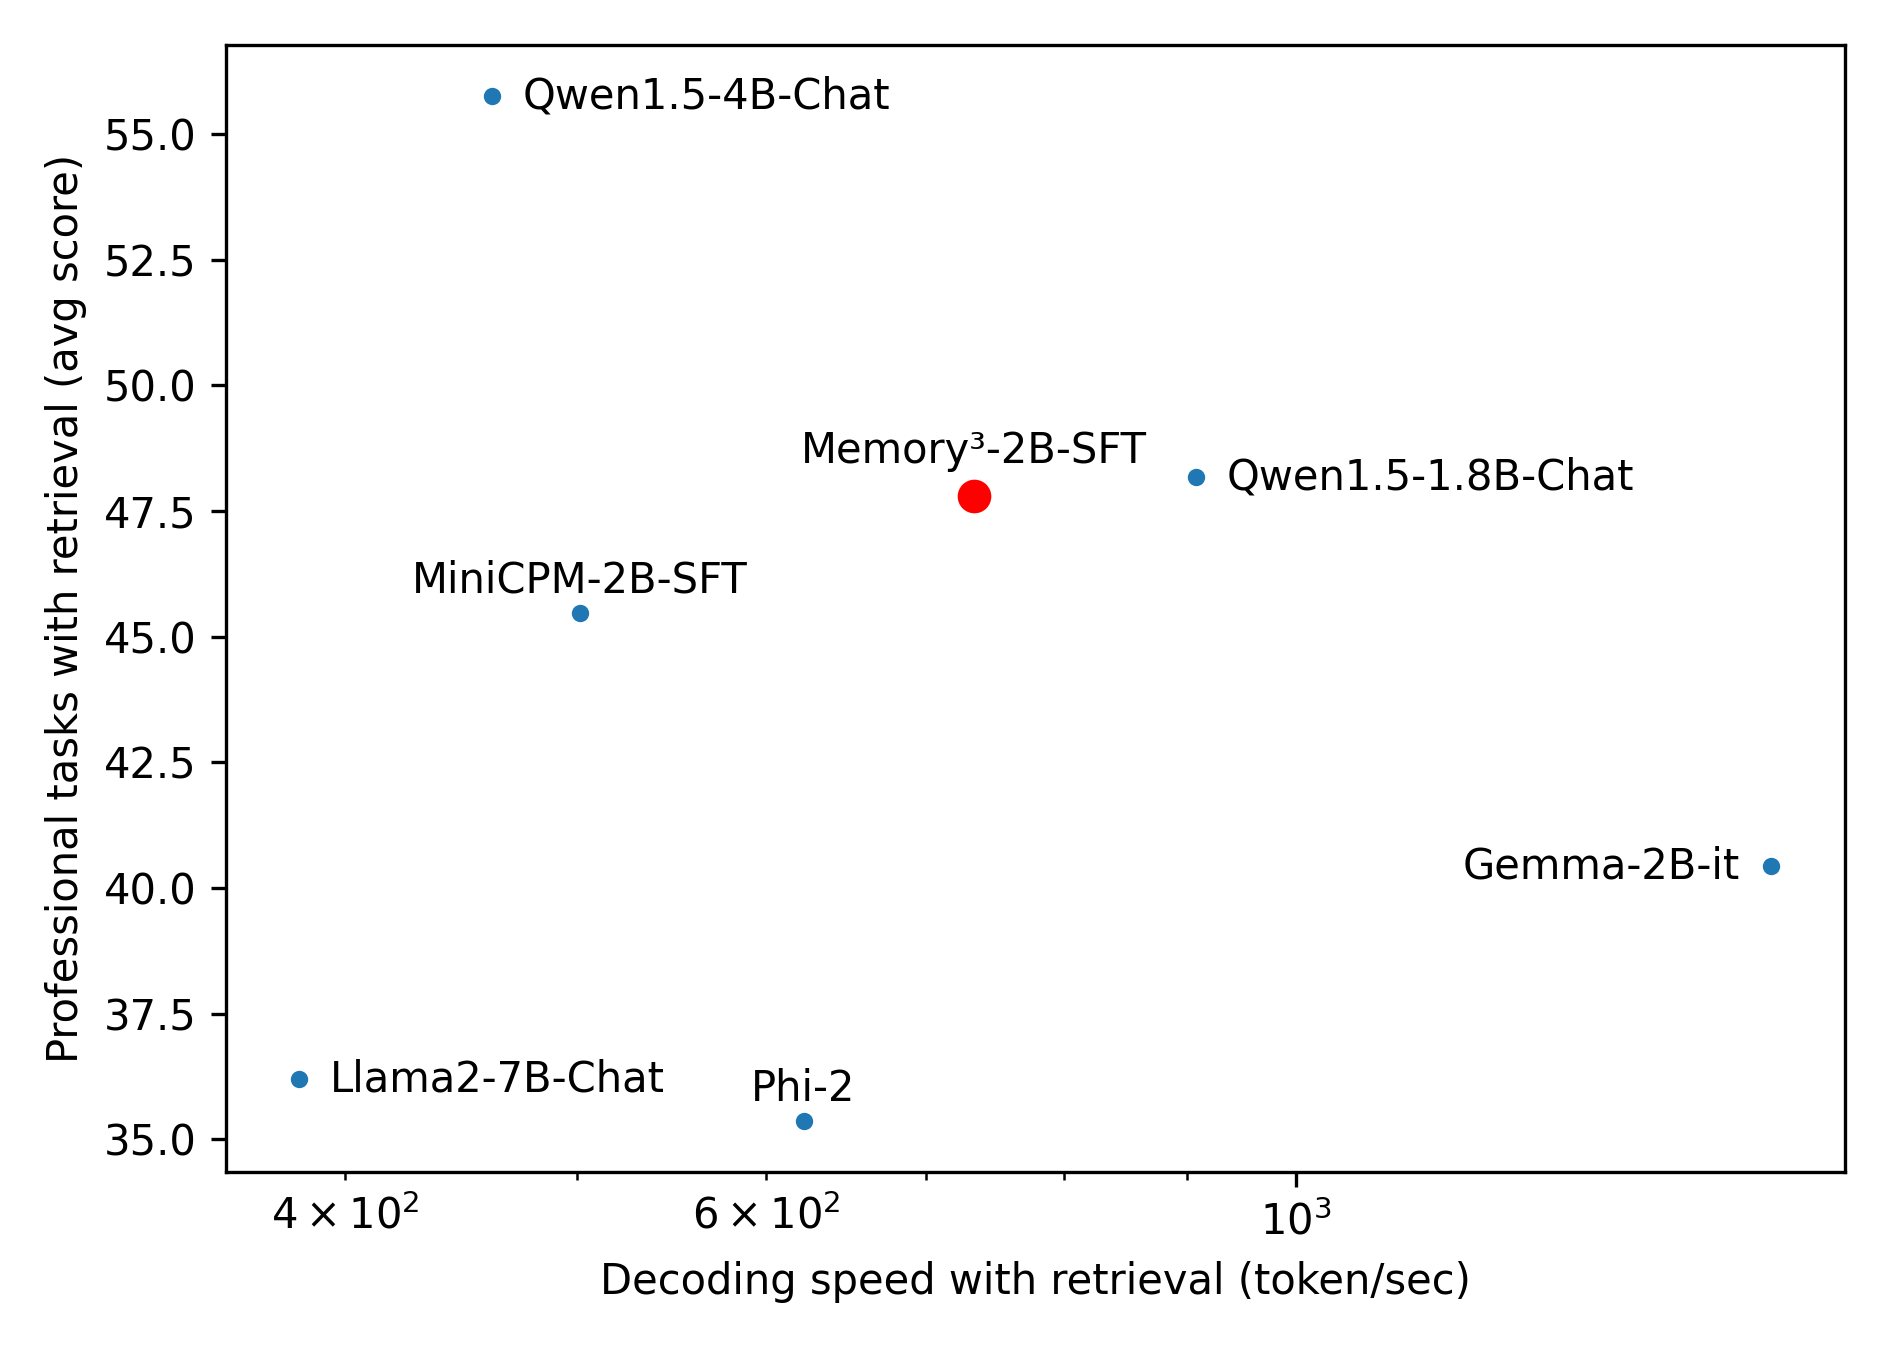
This image is a scatter plot comparing seven different language models based on two metrics: their decoding speed with retrieval (x-axis) and their average score on professional tasks with retrieval (y-axis). The plot visualizes the trade-off between inference speed and task performance for these models.
### Components/Axes
* **X-Axis:** "Decoding speed with retrieval (token/sec)". The scale is logarithmic, with major tick marks labeled at `4 × 10²` (400), `6 × 10²` (600), and `10³` (1000). The axis spans from approximately 350 to 1500 tokens/sec.
* **Y-Axis:** "Professional tasks with retrieval (avg score)". The scale is linear, ranging from 35.0 to 55.0, with major tick marks every 2.5 units (35.0, 37.5, 40.0, etc.).
* **Data Points:** Seven labeled points represent different models. Six are blue circles, and one is a red circle, indicating it is the primary subject of comparison.
* **Labels:** Each data point is directly labeled with the model name. There is no separate legend box; the color (blue vs. red) is the only distinguishing visual cue beyond the labels themselves.
### Detailed Analysis
The plot contains the following data points, listed from left (slower) to right (faster) along the x-axis:
| Model | Color | Approx. Decoding Speed (tokens/sec) | Approx. Avg. Score |
| :--- | :--- | :--- | :--- |
| Llama2-7B-Chat | Blue | 380 | 36.2 |
| Qwen1.5-4B-Chat | Blue | 450 | 55.5 |
| MiniCPM-2B-SFT | Blue | 520 | 45.5 |
| Phi-2 | Blue | 620 | 35.3 |
| Memory³-2B-SFT | Red | 700 | 47.8 |
| Qwen1.5-1.8B-Chat | Blue | 900 | 48.2 |
| Gemma-2B-it | Blue | 1400 | 40.3 |
### Key Observations
* **Performance-Speed Trade-off:** There is a general, but not strict, inverse relationship. The model with the highest performance (Qwen1.5-4B-Chat) is among the slowest, while the fastest model (Gemma-2B-it) has a lower average score.
* **Highlighted Model:** The red point, **Memory³-2B-SFT**, occupies a central position. It achieves a relatively high performance score (47.8) while maintaining a moderate decoding speed (700 tokens/sec), suggesting a balance between the two metrics.
* **Outliers:**
* **Qwen1.5-4B-Chat** is a clear outlier in performance, scoring significantly higher than all other models despite its slower speed.
* **Phi-2** has the lowest performance score but is not the fastest model.
* **Clustering:** The models MiniCPM-2B-SFT, Memory³-2B-SFT, and Qwen1.5-1.8B-Chat form a cluster in the middle of the performance range (scores ~45-48) with varying speeds.
### Interpretation
This chart is designed to benchmark the **Memory³-2B-SFT** model against other small-to-medium language models. The data suggests that Memory³-2B-SFT offers a compelling compromise: it delivers professional task performance comparable to the larger Qwen1.5-1.8B-Chat model while being slower, but it significantly outperforms similarly fast or faster models like Phi-2 and Gemma-2B-it.
The plot implies that for applications requiring both reasonable speed and competent performance on professional tasks, Memory³-2B-SFT presents a favorable option. The extreme performance of Qwen1.5-4B-Chat indicates that larger model size (4B parameters) can yield substantial accuracy gains, but at a notable cost to inference speed. The chart effectively argues for the value proposition of the Memory³ architecture in balancing these competing demands.