## Chart: Pass@K Performance Comparison
### Overview
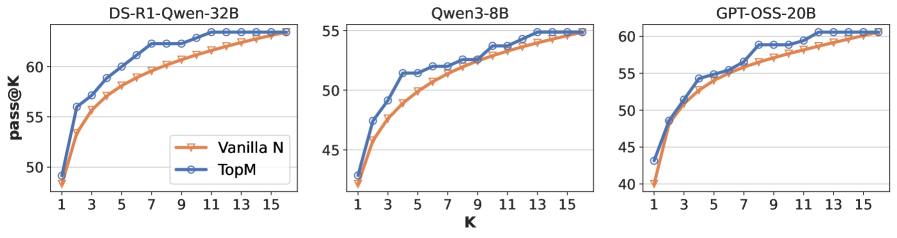
The image presents three line charts comparing the "pass@K" performance of different language models: DS-R1-Qwen-32B, Qwen3-8B, and GPT-OSS-20B. Each chart plots "pass@K" (y-axis) against "K" (x-axis) for two methods: "Vanilla N" and "TopM". The charts show how the performance changes as K increases.
### Components/Axes
* **Titles:**
* Left Chart: DS-R1-Qwen-32B
* Middle Chart: Qwen3-8B
* Right Chart: GPT-OSS-20B
* **X-axis:**
* Label: K
* Scale: 1, 3, 5, 7, 9, 11, 13, 15
* **Y-axis:**
* Label: pass@K
* Scale: 40, 45, 50, 55, 60
* **Legend:** Located in the center-left of the image.
* Vanilla N (Orange Line with Triangle Markers)
* TopM (Blue Line with Circle Markers)
### Detailed Analysis
**Chart 1: DS-R1-Qwen-32B**
* **Vanilla N (Orange):** The line starts at approximately 49 at K=1, rises sharply to approximately 56 at K=5, and then gradually increases to approximately 61 at K=15.
* **TopM (Blue):** The line starts at approximately 49 at K=1, rises sharply to approximately 58 at K=5, and then gradually increases to approximately 63 at K=15.
**Chart 2: Qwen3-8B**
* **Vanilla N (Orange):** The line starts at approximately 42 at K=1, rises sharply to approximately 49 at K=5, and then gradually increases to approximately 53 at K=15.
* **TopM (Blue):** The line starts at approximately 42 at K=1, rises sharply to approximately 52 at K=5, and then gradually increases to approximately 55 at K=15.
**Chart 3: GPT-OSS-20B**
* **Vanilla N (Orange):** The line starts at approximately 40 at K=1, rises sharply to approximately 54 at K=5, and then gradually increases to approximately 60 at K=15.
* **TopM (Blue):** The line starts at approximately 43 at K=1, rises sharply to approximately 56 at K=5, and then gradually increases to approximately 61 at K=15.
### Key Observations
* In all three charts, the "TopM" method (blue line) consistently outperforms the "Vanilla N" method (orange line) across all values of K.
* The performance gain from increasing K diminishes as K gets larger. The curves flatten out after K=9.
* The DS-R1-Qwen-32B model achieves the highest "pass@K" scores, followed by GPT-OSS-20B, and then Qwen3-8B.
### Interpretation
The charts demonstrate the impact of the "TopM" sampling method on the "pass@K" performance of different language models. The data suggests that "TopM" consistently improves performance compared to the "Vanilla N" method. The diminishing returns as K increases indicate that there is a point beyond which increasing the number of samples (K) provides little additional benefit. The relative performance of the models suggests that DS-R1-Qwen-32B is the most effective among the three, followed by GPT-OSS-20B and Qwen3-8B. This could be due to differences in model size, architecture, or training data.