## Scatter Plot: Timing vs. Guess
### Overview
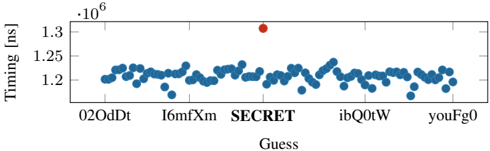
The image is a scatter plot showing the timing (in milliseconds) versus different guesses. Most guesses result in similar timing values, clustered around 1.2 * 10^6 ms, but one guess labeled "SECRET" has a significantly higher timing value.
### Components/Axes
* **X-axis:** "Guess" with labels "02OdDt", "I6mfXm", "SECRET", "ibQ0tW", "youFg0".
* **Y-axis:** "Timing [ms]" with a multiplier "·10^6". The y-axis ranges from approximately 1.18 * 10^6 ms to 1.32 * 10^6 ms. The y-axis markers are at 1.2 * 10^6, 1.25 * 10^6, and 1.3 * 10^6.
* **Data Points:** Blue dots represent the timing for each guess. The "SECRET" guess is represented by a red dot.
### Detailed Analysis
* The majority of the blue data points are clustered between 1.19 * 10^6 ms and 1.24 * 10^6 ms.
* The red data point, corresponding to the "SECRET" guess, is located at approximately 1.31 * 10^6 ms.
* The guesses "02OdDt", "I6mfXm", "ibQ0tW", and "youFg0" all have similar timing values.
### Key Observations
* The "SECRET" guess has a significantly higher timing value compared to the other guesses.
* The timing values for the other guesses are relatively consistent.
### Interpretation
The scatter plot suggests that the "SECRET" guess takes significantly longer to process compared to the other guesses. This could indicate a vulnerability or a deliberate design feature where the system takes longer to process the correct guess. The consistent timing values for the other guesses suggest that they are processed in a similar manner. The plot highlights a potential timing attack vulnerability, where an attacker could determine the correct guess by observing the processing time.