## Line Graph: LM Loss vs. PFlOP/s-days Projections
### Overview
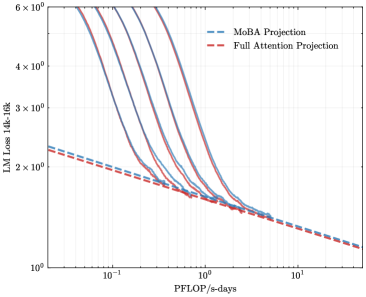
The image is a line graph comparing two computational projections: "MoBA Projection" (blue dashed line) and "Full Attention Projection" (red dashed line). The graph plots "LM Loss 14k-16k" (y-axis) against "PFlOP/s-days" (x-axis) on a logarithmic scale. Both lines exhibit a decreasing trend, with the blue line consistently positioned above the red line across the x-axis range.
### Components/Axes
- **X-axis (PFlOP/s-days)**: Logarithmic scale ranging from 10⁻¹ to 10¹. Markers at 10⁻¹, 10⁰, and 10¹.
- **Y-axis (LM Loss 14k-16k)**: Logarithmic scale ranging from 10⁰ to 6×10⁰. Markers at 10⁰, 2×10⁰, 3×10⁰, 4×10⁰, 5×10⁰, and 6×10⁰.
- **Legend**: Located in the top-right corner, with blue dashed line labeled "MoBA Projection" and red dashed line labeled "Full Attention Projection."
### Detailed Analysis
- **MoBA Projection (Blue Dashed Line)**:
- Starts near 6×10⁰ at x=10⁻¹.
- Decreases gradually, reaching ~1.5×10⁰ at x=10¹.
- Maintains a steady downward slope with minimal curvature.
- **Full Attention Projection (Red Dashed Line)**:
- Starts near 5×10⁰ at x=10⁻¹.
- Decreases more sharply initially, then flattens slightly.
- Ends near ~1×10⁰ at x=10¹.
- **Key Intersection**: The two lines converge near x=10⁰, where both approximate 2×10⁰ LM Loss.
### Key Observations
1. **Parallel Trends**: Both lines exhibit similar logarithmic decay patterns, suggesting a proportional relationship between PFlOP/s-days and LM Loss.
2. **Consistent Gap**: The blue line (MoBA) remains ~10–20% higher than the red line (Full Attention) across all x-values.
3. **Logarithmic Scale Impact**: The y-axis compression emphasizes relative differences rather than absolute values, highlighting proportional efficiency gains.
### Interpretation
The data suggests that the **MoBA Projection** consistently incurs higher LM Loss than the **Full Attention Projection** for equivalent computational resources (PFlOP/s-days). The parallel decay implies that both projections scale similarly with increased computational power, but MoBA’s higher baseline loss indicates inherent inefficiencies or architectural limitations. The convergence near x=10⁰ may reflect a threshold where computational gains begin to offset model complexity differences. This could inform resource allocation decisions, favoring Full Attention for lower-loss outcomes.