## Stacked Bar Chart: Rating Distribution by Model
### Overview
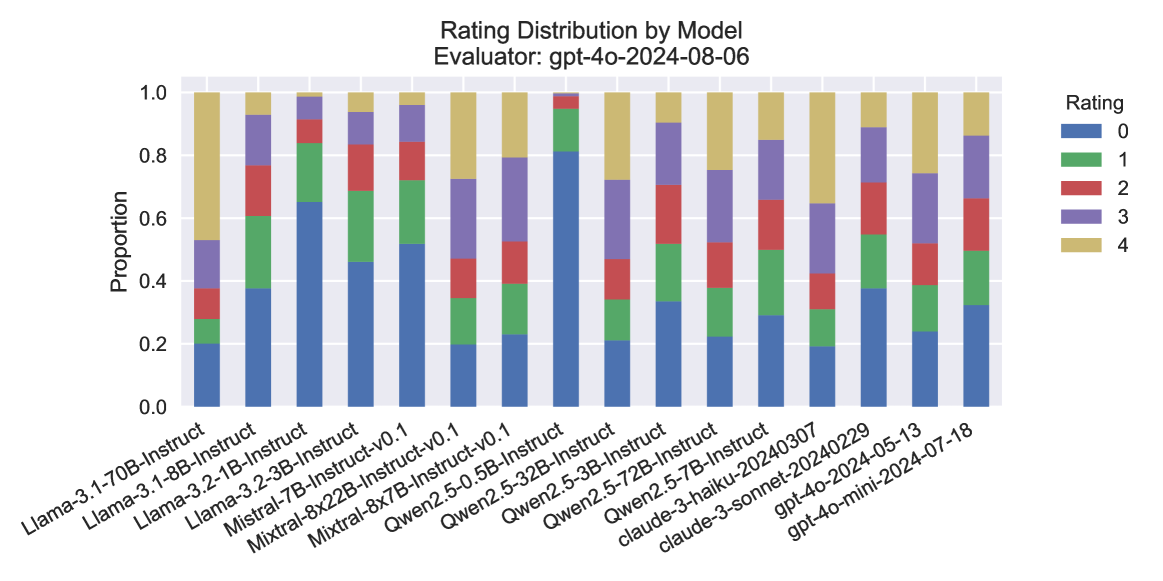
The image is a stacked bar chart showing the distribution of ratings for various language models. The x-axis represents different models, and the y-axis represents the proportion of each rating (0-4) assigned to each model. The chart is titled "Rating Distribution by Model" and specifies the evaluator as "gpt-4o-2024-08-06".
### Components/Axes
* **Title:** Rating Distribution by Model
* **Subtitle:** Evaluator: gpt-4o-2024-08-06
* **X-axis:** Language Models (categorical)
* Llama-3.1-70B-Instruct
* Llama-3.1-8B-Instruct
* Llama-3.2-1B-Instruct
* Llama-3.2-3B-Instruct
* Mistral-7B-Instruct-v0.1
* Mixtral-8x22B-Instruct-v0.1
* Mixtral-8x7B-Instruct-v0.1
* Qwen2.5-0.5B-Instruct
* Qwen2.5-3B-Instruct
* Qwen2.5-32B-Instruct
* Qwen2.5-72B-Instruct
* Qwen2.5-7B-Instruct
* claude-3-haiku-20240307
* claude-3-sonnet-20240229
* gpt-4o-2024-05-13
* gpt-4o-mini-2024-07-18
* **Y-axis:** Proportion (numerical), ranging from 0.0 to 1.0 in increments of 0.2.
* **Legend:** Located on the top-right of the chart.
* Blue: Rating 0
* Green: Rating 1
* Red: Rating 2
* Purple: Rating 3
* Tan/Beige: Rating 4
### Detailed Analysis
The chart presents a stacked bar for each language model, where the height of each colored segment represents the proportion of ratings for that category.
* **Llama-3.1-70B-Instruct:**
* Rating 0: ~0.25
* Rating 1: ~0.20
* Rating 2: ~0.15
* Rating 3: ~0.20
* Rating 4: ~0.20
* **Llama-3.1-8B-Instruct:**
* Rating 0: ~0.35
* Rating 1: ~0.25
* Rating 2: ~0.15
* Rating 3: ~0.15
* Rating 4: ~0.10
* **Llama-3.2-1B-Instruct:**
* Rating 0: ~0.30
* Rating 1: ~0.25
* Rating 2: ~0.15
* Rating 3: ~0.15
* Rating 4: ~0.15
* **Llama-3.2-3B-Instruct:**
* Rating 0: ~0.35
* Rating 1: ~0.25
* Rating 2: ~0.15
* Rating 3: ~0.15
* Rating 4: ~0.10
* **Mistral-7B-Instruct-v0.1:**
* Rating 0: ~0.20
* Rating 1: ~0.20
* Rating 2: ~0.15
* Rating 3: ~0.25
* Rating 4: ~0.20
* **Mixtral-8x22B-Instruct-v0.1:**
* Rating 0: ~0.20
* Rating 1: ~0.20
* Rating 2: ~0.10
* Rating 3: ~0.30
* Rating 4: ~0.20
* **Mixtral-8x7B-Instruct-v0.1:**
* Rating 0: ~0.20
* Rating 1: ~0.20
* Rating 2: ~0.15
* Rating 3: ~0.25
* Rating 4: ~0.20
* **Qwen2.5-0.5B-Instruct:**
* Rating 0: ~0.40
* Rating 1: ~0.25
* Rating 2: ~0.15
* Rating 3: ~0.10
* Rating 4: ~0.10
* **Qwen2.5-3B-Instruct:**
* Rating 0: ~0.40
* Rating 1: ~0.25
* Rating 2: ~0.15
* Rating 3: ~0.10
* Rating 4: ~0.10
* **Qwen2.5-32B-Instruct:**
* Rating 0: ~0.40
* Rating 1: ~0.25
* Rating 2: ~0.15
* Rating 3: ~0.10
* Rating 4: ~0.10
* **Qwen2.5-72B-Instruct:**
* Rating 0: ~0.40
* Rating 1: ~0.25
* Rating 2: ~0.15
* Rating 3: ~0.10
* Rating 4: ~0.10
* **Qwen2.5-7B-Instruct:**
* Rating 0: ~0.40
* Rating 1: ~0.25
* Rating 2: ~0.15
* Rating 3: ~0.10
* Rating 4: ~0.10
* **claude-3-haiku-20240307:**
* Rating 0: ~0.30
* Rating 1: ~0.25
* Rating 2: ~0.20
* Rating 3: ~0.15
* Rating 4: ~0.10
* **claude-3-sonnet-20240229:**
* Rating 0: ~0.35
* Rating 1: ~0.25
* Rating 2: ~0.20
* Rating 3: ~0.10
* Rating 4: ~0.10
* **gpt-4o-2024-05-13:**
* Rating 0: ~0.20
* Rating 1: ~0.30
* Rating 2: ~0.25
* Rating 3: ~0.15
* Rating 4: ~0.10
* **gpt-4o-mini-2024-07-18:**
* Rating 0: ~0.30
* Rating 1: ~0.30
* Rating 2: ~0.20
* Rating 3: ~0.10
* Rating 4: ~0.10
### Key Observations
* Models like Qwen2.5 variants tend to have a higher proportion of rating 0 compared to other models.
* Models like Mistral and Mixtral have a more even distribution of ratings, with a higher proportion of ratings 3 and 4 compared to Qwen2.5.
* The gpt-4o models show a relatively high proportion of rating 1.
### Interpretation
The chart provides a comparative view of how different language models are rated by the "gpt-4o-2024-08-06" evaluator. The distribution of ratings suggests that some models are consistently rated lower (e.g., Qwen2.5 variants), while others receive a more balanced distribution of ratings. This could indicate differences in the models' performance, capabilities, or suitability for the tasks evaluated. The gpt-4o models show a different rating pattern, possibly reflecting a different evaluation focus or inherent characteristics of these models. The data highlights the subjective nature of model evaluation and the importance of considering the evaluation context.