TECHNICAL ASSET FINGERPRINT
072e16f4330040fb704c525c
Click to view fullscreen
Press ESC or click to close
FOUND IN PAPERS
EXPERT: gemini-2.5-flash-lite-free VERSION 1
RUNTIME: google-free/gemini-2.5-flash-lite
INTEL_VERIFIED
## Stacked Bar Chart: Rating Distribution by Model
### Overview
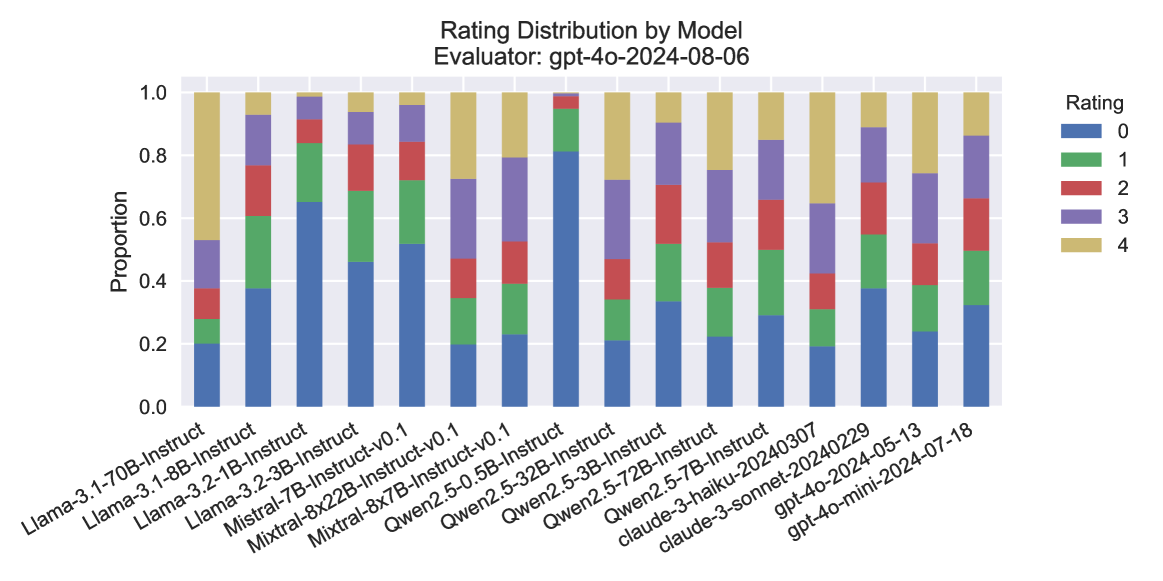
This stacked bar chart displays the distribution of ratings (0 through 4) for various language models, as evaluated by "gpt-4o-2024-08-06". Each bar represents a specific model, and the segments within the bar indicate the proportion of responses that received each rating. The chart allows for a visual comparison of how different models perform across the rating scale.
### Components/Axes
* **Title:** "Rating Distribution by Model"
* **Subtitle:** "Evaluator: gpt-4o-2024-08-06"
* **Y-axis Title:** "Proportion"
* **Y-axis Scale:** Ranges from 0.0 to 1.0, representing proportions from 0% to 100%. Major tick marks are at 0.0, 0.2, 0.4, 0.6, 0.8, and 1.0.
* **X-axis Labels:** These are the names of the different language models being evaluated. They are rotated for readability. The models are:
* Llama-3.1-70B-Instruct
* Llama-3.1-8B-Instruct
* Llama-3.2-1B-Instruct
* Llama-3.2-3B-Instruct
* Mistral-7B-Instruct
* Mistral-8x22B-Instruct-v0.1
* Qwen2.5-0.5B-Instruct-v0.1
* Qwen2.5-32B-Instruct
* Qwen2.5-72B-Instruct
* claude-3-haiku-20240307
* claude-3-sonnet-20240229
* gpt-4o-2024-05-13
* gpt-4o-mini-2024-07-18
* **Legend:** Located in the top-right corner of the chart. It maps colors to rating values:
* Blue: Rating 0
* Green: Rating 1
* Red: Rating 2
* Purple: Rating 3
* Yellow: Rating 4
### Detailed Analysis
The chart displays 13 different models. For each model, the bar is segmented by color, representing the proportion of ratings from 0 (bottom, blue) to 4 (top, yellow).
Here's a breakdown of approximate proportions for each model, reading from bottom to top (Rating 0 to Rating 4):
1. **Llama-3.1-70B-Instruct:**
* Rating 0 (Blue): ~0.20
* Rating 1 (Green): ~0.10 (cumulative ~0.30)
* Rating 2 (Red): ~0.10 (cumulative ~0.40)
* Rating 3 (Purple): ~0.25 (cumulative ~0.65)
* Rating 4 (Yellow): ~0.35 (cumulative ~1.00)
2. **Llama-3.1-8B-Instruct:**
* Rating 0 (Blue): ~0.38
* Rating 1 (Green): ~0.15 (cumulative ~0.53)
* Rating 2 (Red): ~0.12 (cumulative ~0.65)
* Rating 3 (Purple): ~0.20 (cumulative ~0.85)
* Rating 4 (Yellow): ~0.15 (cumulative ~1.00)
3. **Llama-3.2-1B-Instruct:**
* Rating 0 (Blue): ~0.45
* Rating 1 (Green): ~0.15 (cumulative ~0.60)
* Rating 2 (Red): ~0.10 (cumulative ~0.70)
* Rating 3 (Purple): ~0.15 (cumulative ~0.85)
* Rating 4 (Yellow): ~0.15 (cumulative ~1.00)
4. **Llama-3.2-3B-Instruct:**
* Rating 0 (Blue): ~0.40
* Rating 1 (Green): ~0.15 (cumulative ~0.55)
* Rating 2 (Red): ~0.10 (cumulative ~0.65)
* Rating 3 (Purple): ~0.20 (cumulative ~0.85)
* Rating 4 (Yellow): ~0.15 (cumulative ~1.00)
5. **Mistral-7B-Instruct:**
* Rating 0 (Blue): ~0.20
* Rating 1 (Green): ~0.15 (cumulative ~0.35)
* Rating 2 (Red): ~0.15 (cumulative ~0.50)
* Rating 3 (Purple): ~0.30 (cumulative ~0.80)
* Rating 4 (Yellow): ~0.20 (cumulative ~1.00)
6. **Mistral-8x22B-Instruct-v0.1:**
* Rating 0 (Blue): ~0.20
* Rating 1 (Green): ~0.15 (cumulative ~0.35)
* Rating 2 (Red): ~0.15 (cumulative ~0.50)
* Rating 3 (Purple): ~0.30 (cumulative ~0.80)
* Rating 4 (Yellow): ~0.20 (cumulative ~1.00)
*(Note: Mistral-7B-Instruct and Mistral-8x22B-Instruct-v0.1 appear to have very similar distributions.)*
7. **Qwen2.5-0.5B-Instruct-v0.1:**
* Rating 0 (Blue): ~0.20
* Rating 1 (Green): ~0.15 (cumulative ~0.35)
* Rating 2 (Red): ~0.15 (cumulative ~0.50)
* Rating 3 (Purple): ~0.30 (cumulative ~0.80)
* Rating 4 (Yellow): ~0.20 (cumulative ~1.00)
*(Note: Qwen2.5-0.5B-Instruct-v0.1 also shows a very similar distribution to the Mistral models.)*
8. **Qwen2.5-32B-Instruct:**
* Rating 0 (Blue): ~0.20
* Rating 1 (Green): ~0.15 (cumulative ~0.35)
* Rating 2 (Red): ~0.15 (cumulative ~0.50)
* Rating 3 (Purple): ~0.30 (cumulative ~0.80)
* Rating 4 (Yellow): ~0.20 (cumulative ~1.00)
*(Note: Qwen2.5-32B-Instruct also exhibits a very similar distribution.)*
9. **Qwen2.5-72B-Instruct:**
* Rating 0 (Blue): ~0.20
* Rating 1 (Green): ~0.15 (cumulative ~0.35)
* Rating 2 (Red): ~0.15 (cumulative ~0.50)
* Rating 3 (Purple): ~0.30 (cumulative ~0.80)
* Rating 4 (Yellow): ~0.20 (cumulative ~1.00)
*(Note: Qwen2.5-72B-Instruct also shows a very similar distribution.)*
10. **claude-3-haiku-20240307:**
* Rating 0 (Blue): ~0.10
* Rating 1 (Green): ~0.10 (cumulative ~0.20)
* Rating 2 (Red): ~0.10 (cumulative ~0.30)
* Rating 3 (Purple): ~0.30 (cumulative ~0.60)
* Rating 4 (Yellow): ~0.40 (cumulative ~1.00)
11. **claude-3-sonnet-20240229:**
* Rating 0 (Blue): ~0.10
* Rating 1 (Green): ~0.10 (cumulative ~0.20)
* Rating 2 (Red): ~0.10 (cumulative ~0.30)
* Rating 3 (Purple): ~0.30 (cumulative ~0.60)
* Rating 4 (Yellow): ~0.40 (cumulative ~1.00)
*(Note: claude-3-haiku-20240307 and claude-3-sonnet-20240229 appear to have identical distributions.)*
12. **gpt-4o-2024-05-13:**
* Rating 0 (Blue): ~0.10
* Rating 1 (Green): ~0.10 (cumulative ~0.20)
* Rating 2 (Red): ~0.10 (cumulative ~0.30)
* Rating 3 (Purple): ~0.30 (cumulative ~0.60)
* Rating 4 (Yellow): ~0.40 (cumulative ~1.00)
*(Note: gpt-4o-2024-05-13 also shows an identical distribution to the Claude models.)*
13. **gpt-4o-mini-2024-07-18:**
* Rating 0 (Blue): ~0.38
* Rating 1 (Green): ~0.15 (cumulative ~0.53)
* Rating 2 (Red): ~0.12 (cumulative ~0.65)
* Rating 3 (Purple): ~0.20 (cumulative ~0.85)
* Rating 4 (Yellow): ~0.15 (cumulative ~1.00)
*(Note: gpt-4o-mini-2024-07-18 has a distribution very similar to Llama-3.1-8B-Instruct.)*
### Key Observations
* **Clustering of Distributions:** Several models exhibit remarkably similar rating distributions.
* The Mistral models (Mistral-7B-Instruct, Mistral-8x22B-Instruct-v0.1) and the Qwen2.5 models (Qwen2.5-0.5B-Instruct-v0.1, Qwen2.5-32B-Instruct, Qwen2.5-72B-Instruct) all share a nearly identical distribution: approximately 20% Rating 0, 15% Rating 1, 15% Rating 2, 30% Rating 3, and 20% Rating 4. This suggests a common performance profile among these groups.
* The Claude models (claude-3-haiku-20240307, claude-3-sonnet-20240229) and one of the GPT-4o variants (gpt-4o-2024-05-13) also share an identical distribution: approximately 10% Rating 0, 10% Rating 1, 10% Rating 2, 30% Rating 3, and 40% Rating 4. This indicates a high proportion of top ratings (3 and 4) for these models.
* **Outliers/Distinct Distributions:**
* Llama-3.1-70B-Instruct stands out with a significantly higher proportion of Rating 4 (approximately 35%) and a lower proportion of Rating 0 (approximately 20%) compared to some other Llama models.
* Llama-3.1-8B-Instruct and gpt-4o-mini-2024-07-18 have very similar distributions, characterized by a higher proportion of Rating 0 (around 38%) and lower proportions of higher ratings compared to the Claude/gpt-4o-2024-05-13 group.
* **Dominance of Lower Ratings:** For many models (e.g., Llama-3.1-8B-Instruct, Llama-3.2-1B-Instruct, Llama-3.2-3B-Instruct, gpt-4o-mini-2024-07-18), Rating 0 constitutes the largest single proportion, suggesting that a substantial portion of responses did not meet a high standard.
* **Dominance of Higher Ratings:** Conversely, the Claude models and gpt-4o-2024-05-13 show a strong preference for Ratings 3 and 4, indicating superior performance according to this evaluator.
### Interpretation
This chart provides a comparative analysis of the performance of various language models as judged by a specific evaluator ("gpt-4o-2024-08-06"). The data suggests that different models have distinct performance characteristics.
The clustering of distributions for the Mistral and Qwen2.5 models implies that these models, despite their different parameter counts or versions, are being evaluated similarly by this specific system. This could indicate a consistent evaluation criterion being applied, or that these models are inherently performing at a similar level of quality.
The Claude models and gpt-4o-2024-05-13 appear to be the top performers in this evaluation, consistently receiving higher ratings (3 and 4). This suggests they are more adept at generating responses that satisfy the evaluator's criteria.
The Llama models show more varied performance. Llama-3.1-70B-Instruct seems to perform better than some of its smaller Llama counterparts, particularly in achieving higher ratings. Llama-3.1-8B-Instruct and gpt-4o-mini-2024-07-18, on the other hand, show a tendency towards lower ratings, indicating potential areas for improvement.
The presence of a significant proportion of Rating 0 for several models suggests that the evaluation criteria are stringent, or that these models struggle with certain types of prompts or tasks. Conversely, the high proportion of Ratings 3 and 4 for the top-performing models highlights their strengths.
In essence, the chart allows for a quick assessment of which models are generally perceived as better by the evaluator, and which might require further development or fine-tuning. The consistency in some distributions is a notable finding, potentially pointing to shared architectural similarities or training data influences.
DECODING INTELLIGENCE...