\n
## Diagram: Celestial Observations
### Overview
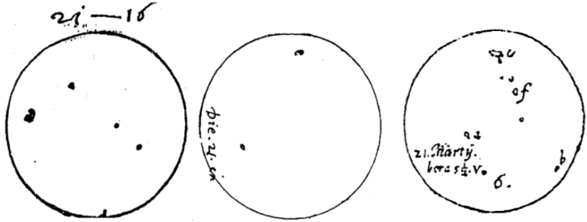
The image presents three circular diagrams, likely representing observations of celestial bodies (stars or planets) at different times. Each diagram contains a series of dots within a circle, accompanied by handwritten annotations. The diagrams appear to be hand-drawn, possibly from a historical astronomical record.
### Components/Axes
Each diagram consists of:
* **Circle:** Represents the field of view or the celestial sphere.
* **Dots:** Represent observed celestial objects.
* **Handwritten Annotations:** Labels indicating dates or other observational details.
The annotations are as follows:
* **Diagram 1 (Left):** "21 - 16" positioned at the top.
* **Diagram 2 (Center):** "Die. 24. ex" positioned at the center-left. (German: "Die" translates to "The", "24" is the day, and "ex" is likely an abbreviation for "exspectata" meaning "expected" or "observed").
* **Diagram 3 (Right):** "21. Marty. brash. v. 6." positioned at the bottom-right. (German: "Marty" likely refers to March, "brash" is likely an abbreviation for "Brasilia" or a location, and "v. 6" could be volume 6 or a page number).
* "24" is also present at the top of the third diagram.
There are no explicit axes or scales. The relative positions of the dots within the circles are the primary data points.
### Detailed Analysis or Content Details
The diagrams show varying densities of dots.
* **Diagram 1:** Contains approximately 6 dots, distributed somewhat evenly within the circle.
* **Diagram 2:** Contains approximately 8 dots, also distributed relatively evenly.
* **Diagram 3:** Contains approximately 10 dots, clustered more towards the top-right quadrant of the circle.
The dots themselves are small and appear to be of uniform size. The annotations are written in a cursive script, suggesting a historical context.
### Key Observations
* The number of observed objects varies between the three diagrams.
* The distribution of objects differs, with Diagram 3 showing a noticeable clustering.
* The annotations suggest observations were made on different dates ("21-16", "Die 24", "21 Marty").
* The annotations are in a mix of numerical and textual formats, and include German words.
### Interpretation
These diagrams likely represent a series of astronomical observations recorded over time. The varying number and distribution of dots could indicate changes in the visibility of celestial objects due to their movement, atmospheric conditions, or the observer's location. The annotations provide a temporal context for these observations. The use of German suggests the observations were made by a German-speaking astronomer or in a German-speaking region.
The clustering in Diagram 3 could represent a specific constellation or a group of stars that were particularly prominent on that date. The diagrams, while simple, provide valuable insights into historical astronomical practices and the methods used to record celestial phenomena. The lack of precise coordinates or scales suggests these were qualitative observations rather than precise measurements. The diagrams are not providing quantitative data, but rather a visual record of what was observed.