## Line Chart: Training and Evaluation Reward Curves
### Overview
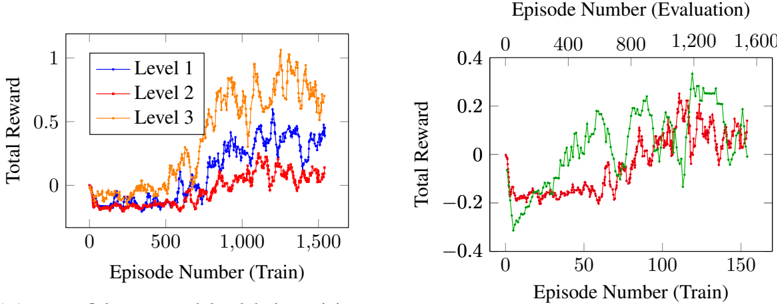
The image presents two line charts displaying the total reward obtained during training and evaluation across three levels. The left chart shows the reward during the training phase, while the right chart shows the reward during the evaluation phase. Both charts use episode number as the independent variable and total reward as the dependent variable.
### Components/Axes
* **Left Chart:**
* X-axis: "Episode Number (Train)" ranging from 0 to 1500, with tick marks at 0, 500, 1000, and 1500.
* Y-axis: "Total Reward" ranging from -0.2 to 1.0, with tick marks at 0, 0.2, 0.4, 0.6, 0.8, and 1.0.
* Legend: Located in the top-left corner, with labels "Level 1" (blue line), "Level 2" (red line), and "Level 3" (orange line).
* **Right Chart:**
* X-axis: "Episode Number (Train)" ranging from 0 to 150, with tick marks at 0, 50, 100, and 150.
* Y-axis: "Total Reward" ranging from -0.4 to 0.4, with tick marks at -0.4, -0.2, 0, 0.2, and 0.4.
* Legend: No explicit legend is present, but the lines are colored as follows: green, red, and blue.
* **Header:** "Episode Number (Evaluation)" with tick marks at 0, 400, 800, 1200, and 1600. This is positioned above the right chart.
### Detailed Analysis or Content Details
* **Left Chart (Training Reward):**
* **Level 1 (Blue):** Starts around -0.1 at episode 0, increases gradually to approximately 0.5 around episode 500, fluctuates between 0.3 and 0.7, and reaches a maximum of approximately 0.8 around episode 1300, finishing at approximately 0.5.
* **Level 2 (Red):** Starts around -0.1 at episode 0, increases to approximately 0.3 around episode 500, fluctuates between 0.1 and 0.5, and reaches a maximum of approximately 0.6 around episode 1200, finishing at approximately 0.2.
* **Level 3 (Orange):** Starts around -0.1 at episode 0, increases to approximately 0.4 around episode 500, fluctuates between 0.2 and 0.8, and reaches a maximum of approximately 0.9 around episode 1000, finishing at approximately 0.3.
* **Right Chart (Evaluation Reward):**
* **Green Line:** Starts around 0.1 at episode 0, increases to approximately 0.25 around episode 50, fluctuates between 0 and 0.3, and finishes at approximately 0.2.
* **Red Line:** Starts around 0 at episode 0, decreases to approximately -0.2 around episode 20, fluctuates between -0.3 and 0.1, and finishes at approximately -0.1.
* **Blue Line:** Starts around 0 at episode 0, decreases to approximately -0.3 around episode 20, fluctuates between -0.4 and 0, and finishes at approximately -0.2.
### Key Observations
* The training reward (left chart) generally increases with the episode number for all levels, indicating learning progress. Level 3 consistently achieves the highest reward during training.
* The evaluation reward (right chart) shows more variability and generally lower rewards compared to the training reward.
* Level 2 and Level 3 show a negative reward during the initial evaluation episodes.
* The evaluation reward for Level 1 (green line) is consistently positive, while the evaluation rewards for Level 2 (red line) and Level 3 (blue line) are mostly negative.
### Interpretation
The charts demonstrate the learning process of an agent across three levels of complexity. The increasing training rewards suggest that the agent is improving its performance as it interacts with the environment. However, the evaluation rewards indicate a potential gap between training and generalization performance. The negative evaluation rewards for Levels 2 and 3 suggest that the agent may be overfitting to the training environment or struggling to adapt to unseen scenarios. The consistent positive evaluation reward for Level 1 suggests that the agent is able to generalize well to new situations in this level. The difference between the training and evaluation rewards highlights the importance of evaluating the agent's performance on a separate dataset to assess its true capabilities. The higher rewards achieved by Level 3 during training suggest that it is the most challenging level, but also the one where the agent has the greatest potential for improvement.