## Line Graphs: Model Performance Across Training Parameters
### Overview
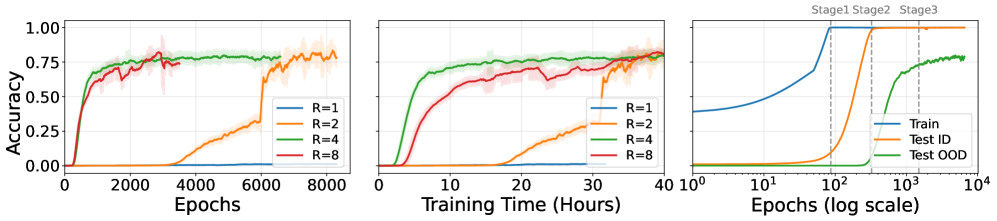
The image contains three line graphs comparing model accuracy across different training parameters (R values) and stages. Each graph uses distinct axes and visualizations to highlight performance trends.
---
### Components/Axes
1. **Left Graph**
- **X-axis**: Epochs (0–8000)
- **Y-axis**: Accuracy (0.00–1.00)
- **Legend**:
- R=1 (blue)
- R=2 (orange)
- R=4 (green)
- R=8 (red)
- **Shading**: Confidence intervals (light gray around lines).
2. **Middle Graph**
- **X-axis**: Training Time (Hours) (0–40)
- **Y-axis**: Accuracy (0.00–1.00)
- **Legend**: Same R values as left graph.
- **Shading**: Confidence intervals.
3. **Right Graph**
- **X-axis**: Epochs (log scale, 10⁰–10⁴)
- **Y-axis**: Accuracy (0.00–1.00)
- **Legend**:
- Train (blue)
- Test ID (orange)
- Test OOD (green)
- **Vertical Dashed Lines**: Stage1, Stage2, Stage3 markers.
---
### Detailed Analysis
#### Left Graph (Epochs vs Accuracy)
- **R=1 (blue)**: Starts at ~0.05 accuracy, plateaus at ~0.75 by 2000 epochs.
- **R=2 (orange)**: Gradual rise to ~0.75 by 6000 epochs.
- **R=4 (green)**: Stable at ~0.75 from ~2000 epochs.
- **R=8 (red)**: Sharp increase to ~0.85 by 6000 epochs.
- **Uncertainty**: All lines have ±0.05–0.10 variability (shaded regions).
#### Middle Graph (Training Time vs Accuracy)
- **R=1 (blue)**: Reaches ~0.75 by 10 hours, then plateaus.
- **R=2 (orange)**: Slower rise to ~0.75 by 30 hours.
- **R=4 (green)**: Stable at ~0.75 after 10 hours.
- **R=8 (red)**: Rapid rise to ~0.85 by 20 hours.
#### Right Graph (Log-Scaled Epochs vs Accuracy)
- **Train (blue)**: Exponential growth, plateaus at ~0.95 by 10³ epochs.
- **Test ID (orange)**: Sharp rise to ~0.95 by 10² epochs, then plateaus.
- **Test OOD (green)**: Gradual rise to ~0.75 by 10³ epochs.
- **Stages**:
- Stage1: ~10¹ epochs (blue/orange divergence).
- Stage2: ~10² epochs (orange plateau).
- Stage3: ~10³ epochs (green rise).
---
### Key Observations
1. **R Value Impact**:
- Higher R (e.g., R=8) achieves faster convergence but risks overfitting (Test OOD lags Test ID).
- Lower R (e.g., R=1) stabilizes earlier but with lower peak accuracy.
2. **Training Dynamics**:
- Test OOD accuracy (~0.75) is significantly lower than Test ID (~0.95), suggesting poor generalization.
- Log-scale visualization emphasizes early-stage performance differences.
3. **Stage Progression**:
- Stage1: Initial training phase (blue/orange divergence).
- Stage2: Model stabilization (orange plateau).
- Stage3: OOD performance improvement (green rise).
---
### Interpretation
- **Model Complexity Trade-off**: Higher R values improve training accuracy but may overfit, as seen in the disparity between Test ID and Test OOD.
- **Efficiency vs Robustness**: Lower R values (e.g., R=1) train faster but sacrifice peak performance.
- **Stage3 Significance**: The gradual rise in Test OOD accuracy suggests late-stage adaptation to out-of-distribution data, possibly through regularization or architectural adjustments.
This analysis underscores the need to balance model complexity (R) with generalization goals, particularly for real-world deployment where OOD performance is critical.