\n
## Line Chart: Conductance Over Time
### Overview
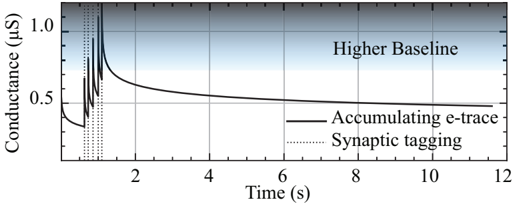
The image presents a line chart illustrating the change in conductance (µS) over time (seconds). Two distinct lines represent "Accumulating e-trace" and "Synaptic tagging". A shaded region labeled "Higher Baseline" is present in the background. The chart focuses on the initial 12 seconds of observation.
### Components/Axes
* **X-axis:** Time (s), ranging from 0 to 12 seconds.
* **Y-axis:** Conductance (µS), ranging from approximately 0 to 1.1 µS.
* **Lines:**
* "Accumulating e-trace" - Solid black line.
* "Synaptic tagging" - Dotted black line.
* **Shaded Region:** "Higher Baseline" - Light blue shaded area covering the majority of the chart area from approximately 2 seconds onwards.
* **Legend:** Located in the bottom-left corner, identifying the lines.
### Detailed Analysis
* **Accumulating e-trace:** This line begins at approximately 0.6 µS at time 0 seconds. It rapidly increases to a peak of approximately 1.0 µS around 0.7 seconds. Following the peak, the line exhibits a steep decline, leveling off to approximately 0.55 µS by 12 seconds. The trend is initially sharply upward, followed by a gradual decay.
* **Synaptic tagging:** This line starts at approximately 0.6 µS at time 0 seconds. It shows a rapid initial increase, peaking at approximately 1.1 µS around 0.6 seconds. The line then rapidly decreases, crossing below 0.5 µS by approximately 2 seconds, and continues to decline, reaching approximately 0.4 µS by 12 seconds. The trend is a sharp initial rise followed by a more rapid decay than the "Accumulating e-trace".
* **Higher Baseline:** The shaded region indicates a higher baseline conductance level, starting around 2 seconds and continuing to 12 seconds. The exact conductance value within this region is not explicitly defined but is visually represented as being above the level of the "Accumulating e-trace" line at 12 seconds.
### Key Observations
* Both conductance traces exhibit a rapid initial increase followed by a decay.
* The "Synaptic tagging" trace has a higher peak conductance and a faster decay rate compared to the "Accumulating e-trace" trace.
* The "Higher Baseline" region suggests a sustained elevated conductance level after the initial transient events.
* The initial rapid increase and subsequent decay of both traces occur within the first 2 seconds.
### Interpretation
The chart likely represents the dynamics of conductance changes in a biological system, potentially related to synaptic plasticity. The "Accumulating e-trace" could represent a cumulative effect of electrical signals, while "Synaptic tagging" might represent a more transient process involved in marking synapses for long-term potentiation or depression. The "Higher Baseline" suggests a sustained change in the system's overall conductance, possibly due to the activation of other pathways or mechanisms. The difference in decay rates between the two traces suggests that the underlying processes have different time scales. The initial rapid increase and decay could represent the initial response to a stimulus, while the subsequent sustained conductance level reflects a longer-lasting effect. The data suggests that synaptic tagging is a faster, more transient process than accumulating e-trace. The higher baseline could indicate a shift in the system's overall excitability.