## Line Chart: EGA Performance vs. Environment Steps for Different Action Counts
### Overview
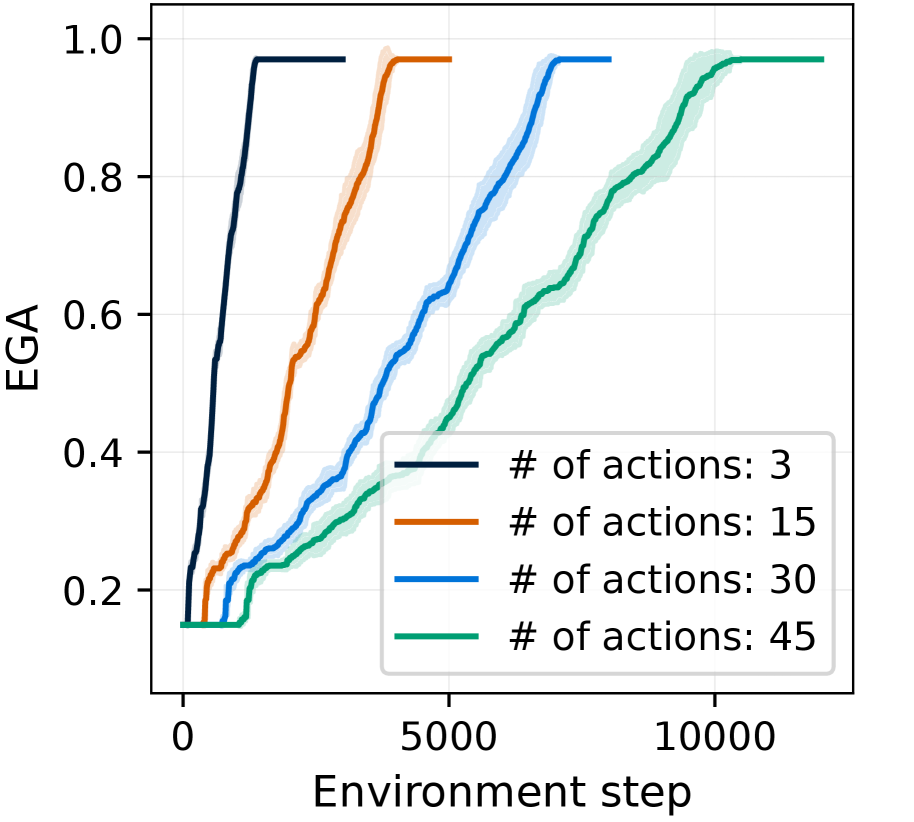
The image is a line chart comparing the performance of a system (measured by "EGA") over the course of training ("Environment step") for four different configurations, each defined by a different number of available actions. The chart demonstrates how the learning speed and final performance plateau are affected by the complexity of the action space.
### Components/Axes
* **Chart Type:** Line chart with shaded confidence intervals or variance bands.
* **Y-Axis:**
* **Label:** "EGA"
* **Scale:** Linear, ranging from 0.0 to 1.0, with major tick marks at 0.0, 0.2, 0.4, 0.6, 0.8, and 1.0.
* **X-Axis:**
* **Label:** "Environment step"
* **Scale:** Linear, ranging from 0 to over 10,000, with major tick marks at 0, 5000, and 10000.
* **Legend:** Located in the bottom-right quadrant of the chart area. It contains four entries, each associating a colored line with a specific condition:
* **Dark Blue Line:** "# of actions: 3"
* **Orange Line:** "# of actions: 15"
* **Light Blue Line:** "# of actions: 30"
* **Green Line:** "# of actions: 45"
* **Data Series:** Four distinct lines, each with a corresponding semi-transparent shaded area of the same color, likely representing standard deviation or confidence intervals across multiple runs.
### Detailed Analysis
The chart plots the trajectory of EGA (likely a performance metric like "Expected Goal Achievement" or similar) as a function of training steps. All four lines follow a similar sigmoidal (S-shaped) growth pattern, starting near 0.15 and eventually plateauing near 1.0, but at markedly different rates.
1. **# of actions: 3 (Dark Blue Line):**
* **Trend:** Exhibits the steepest and fastest ascent.
* **Key Points:** Begins rising almost immediately from step 0. Reaches a performance of ~0.6 by approximately 1,000 steps. Plateaus at a value very close to 1.0 by around 2,000 steps and remains stable thereafter. The shaded variance band is very narrow, indicating consistent performance.
2. **# of actions: 15 (Orange Line):**
* **Trend:** Rises more slowly than the 3-action line but faster than the 30 and 45-action lines.
* **Key Points:** Starts its significant ascent around 500-1,000 steps. Crosses the 0.6 EGA mark at roughly 2,500 steps. Reaches its plateau near 1.0 at approximately 4,000 steps. The variance band is slightly wider than for the 3-action case.
3. **# of actions: 30 (Light Blue Line):**
* **Trend:** Shows a more gradual, nearly linear increase over a long period before plateauing.
* **Key Points:** Begins rising noticeably after 1,000 steps. Reaches 0.6 EGA at about 4,500 steps. Continues a steady climb, approaching the 1.0 plateau around 7,000-8,000 steps. The variance band is moderately wide.
4. **# of actions: 45 (Green Line):**
* **Trend:** Has the slowest rate of increase, with the most prolonged learning phase.
* **Key Points:** Remains near the baseline (~0.15) until approximately 2,000 steps. Shows a steady, almost linear increase from 2,000 to 10,000 steps. Crosses 0.6 EGA at around 6,500 steps. It appears to be approaching but has not fully plateaued at 1.0 by the end of the plotted data at ~12,000 steps. This line has the widest shaded variance band, indicating the highest variability in learning progress.
### Key Observations
* **Clear Inverse Relationship:** There is a direct and consistent inverse relationship between the number of actions and the speed of learning. Fewer actions lead to dramatically faster convergence to high performance.
* **Convergence to Similar Final Performance:** All four configurations appear to be converging toward a similar maximum EGA value of approximately 1.0, suggesting the task is solvable with any of these action space sizes, but the sample efficiency differs greatly.
* **Variance Increases with Complexity:** The width of the shaded confidence intervals increases with the number of actions (widest for 45 actions, narrowest for 3 actions). This indicates that learning becomes not only slower but also more variable and less predictable as the action space grows.
* **Delayed Onset for Complex Tasks:** The start of significant performance improvement is delayed as action count increases. The 45-action line shows a long initial period of minimal improvement before learning begins in earnest.
### Interpretation
This chart illustrates a fundamental trade-off in reinforcement learning or similar sequential decision-making systems: **the curse of dimensionality in the action space.**
* **What the data suggests:** The system learns the task much more efficiently when it has fewer choices (actions) to consider at each step. A smaller action space simplifies the exploration problem, allowing the agent to discover rewarding strategies more quickly. As the action space expands (from 3 to 45), the agent must explore a vastly larger combinatorial space, which requires significantly more environment interactions (steps) to identify effective policies.
* **How elements relate:** The X-axis (Environment step) represents the cost of learning in terms of data or experience. The Y-axis (EGA) represents the payoff or competence. The different lines show how the "price" (in steps) of achieving a certain level of competence (e.g., EGA=0.6) escalates with problem complexity (number of actions).
* **Notable implications:** The findings have practical implications for system design. If possible, simplifying an agent's action space (e.g., through hierarchical action selection, action abstraction, or better state representation) can lead to orders-of-magnitude improvements in learning speed. The increased variance for larger action spaces also suggests that training such agents may require more hyperparameter tuning or more robust algorithms to ensure reliable convergence. The plateau near 1.0 for all lines indicates the task's inherent difficulty is bounded; the challenge lies entirely in the efficiency of the learning process.