\n
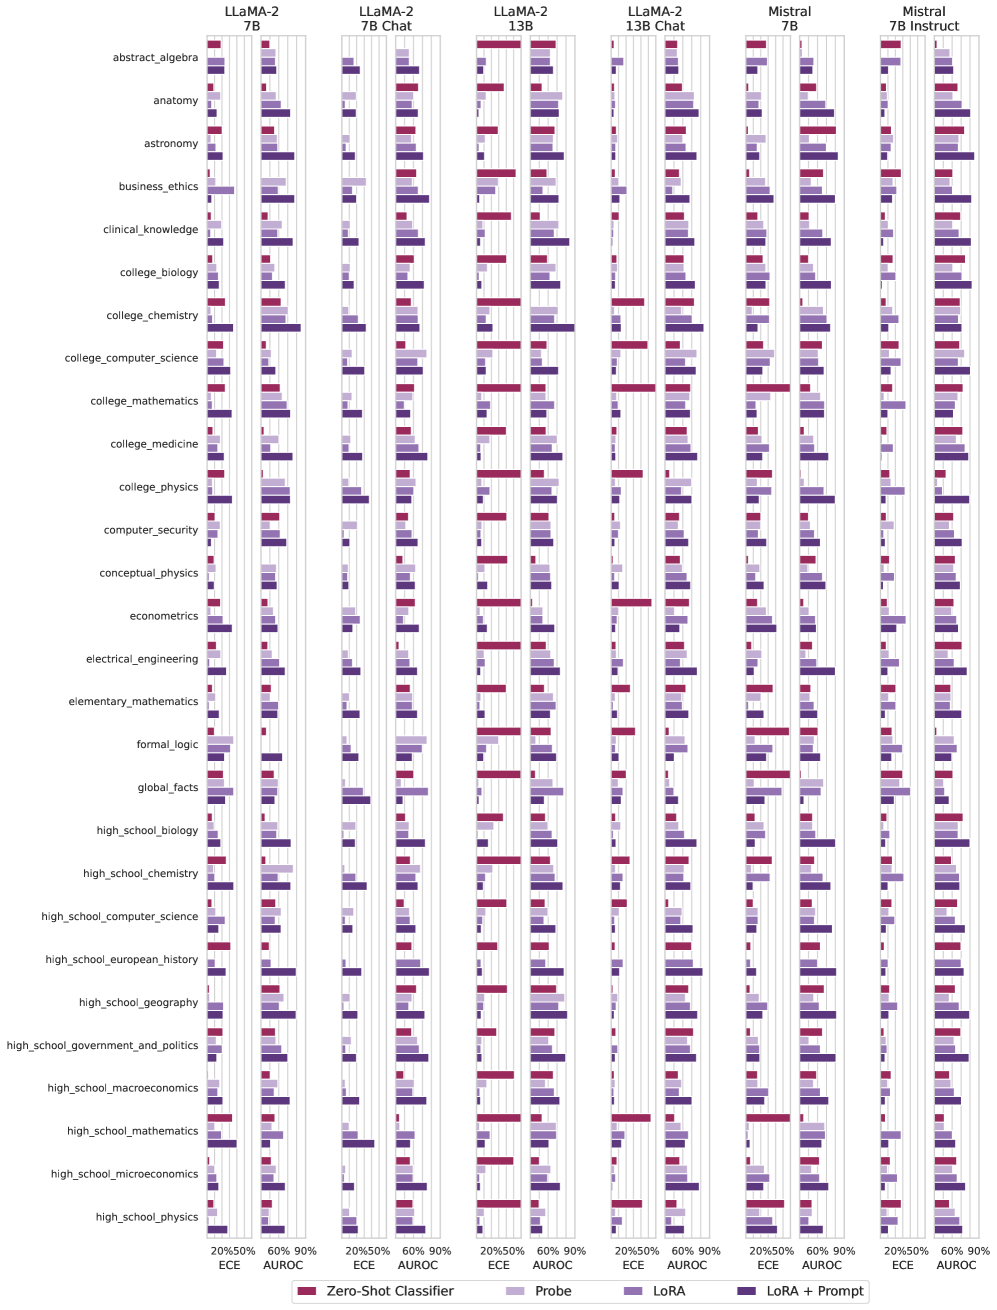
## Heatmap: Model Performance Across Subjects
### Overview
This image presents a heatmap comparing the performance of several Large Language Models (LLMs) – LLaMA-2 (7B, 7B Chat, 13B, 13B Chat) and Mistral (7B, 7B Instruct) – across a range of subjects. Performance is measured using two metrics: ECE (Expected Calibration Error) and AUROC (Area Under the Receiver Operating Characteristic curve). The heatmap uses color intensity to represent the values of these metrics, with darker shades indicating higher values.
### Components/Axes
* **Y-axis (Vertical):** Lists 25 different subjects/domains, including abstract algebra, anatomy, astronomy, business ethics, clinical knowledge, college biology, college chemistry, college computer science, college mathematics, college medicine, college physics, computer security, conceptual physics, econometrics, electrical engineering, elementary mathematics, formal logic, global facts, high school biology, high school chemistry, high school computer science, high school European history, high school geography, high school government and politics, high school macroeconomics, high school mathematics, high school microeconomics, and high school physics.
* **X-axis (Horizontal):** Represents the different LLMs being evaluated. The models are:
* LLaMA-2 7B
* LLaMA-2 7B Chat
* LLaMA-2 13B
* LLaMA-2 13B Chat
* Mistral 7B
* Mistral 7B Instruct
* **Color Scale (Bottom):** Indicates the metric values.
* **Purple:** Represents ECE (Expected Calibration Error). The scale ranges from 20% to 90%.
* **Green:** Represents AUROC (Area Under the Receiver Operating Characteristic curve). The scale ranges from 20% to 90%.
* **Legend (Bottom-Left):**
* Zero-Shot Classifier (Purple)
* Probe (Purple)
* LoRA (Green)
* LoRA + Prompt (Green)
### Detailed Analysis
The heatmap displays performance metrics for each model-subject combination. Each cell's color represents the corresponding ECE or AUROC value.
**LLaMA-2 7B:**
* **ECE:** Generally ranges from approximately 30% to 70% across subjects. Higher values are observed in subjects like high school mathematics, high school physics, and college mathematics. Lower values are seen in subjects like anatomy and astronomy.
* **AUROC:** Generally ranges from approximately 50% to 80% across subjects. Higher values are observed in subjects like high school geography and high school government and politics. Lower values are seen in subjects like high school mathematics and college mathematics.
**LLaMA-2 7B Chat:**
* **ECE:** Similar range to LLaMA-2 7B, approximately 30% to 70%. Notable higher values in high school mathematics and college mathematics.
* **AUROC:** Similar range to LLaMA-2 7B, approximately 50% to 80%. Higher values in high school geography and high school government and politics.
**LLaMA-2 13B:**
* **ECE:** Generally lower than the 7B models, ranging from approximately 20% to 60%.
* **AUROC:** Generally higher than the 7B models, ranging from approximately 60% to 90%.
**LLaMA-2 13B Chat:**
* **ECE:** Similar to LLaMA-2 13B, ranging from approximately 20% to 60%.
* **AUROC:** Similar to LLaMA-2 13B, ranging from approximately 60% to 90%.
**Mistral 7B:**
* **ECE:** Ranges from approximately 20% to 70%.
* **AUROC:** Ranges from approximately 50% to 80%.
**Mistral 7B Instruct:**
* **ECE:** Generally lower than Mistral 7B, ranging from approximately 20% to 60%.
* **AUROC:** Generally higher than Mistral 7B, ranging from approximately 60% to 90%.
**Trends:**
* Larger models (13B) generally exhibit lower ECE and higher AUROC values compared to smaller models (7B).
* The "Chat" versions of the models often show slightly different performance profiles than their base counterparts.
* Performance varies significantly across subjects. Mathematics and physics-related subjects tend to have higher ECE and lower AUROC, indicating poorer calibration and discrimination.
### Key Observations
* The 13B models consistently outperform the 7B models across most subjects.
* Mistral 7B Instruct performs comparably to LLaMA-2 13B and 13B Chat in many subjects.
* Subjects like high school mathematics and college mathematics consistently present challenges for all models, as indicated by high ECE and low AUROC.
* Subjects like high school geography and high school government and politics consistently show better performance, with low ECE and high AUROC.
### Interpretation
This heatmap provides a comparative analysis of LLM performance across a diverse set of subjects. The data suggests that model size is a significant factor in performance, with larger models demonstrating better calibration and discrimination. The differences between base models and "Chat" versions highlight the impact of instruction tuning. The subject-specific variations reveal that LLMs struggle with certain domains (e.g., mathematics, physics) while excelling in others (e.g., geography, government).
The ECE metric indicates how well the model's predicted probabilities align with its actual accuracy. Higher ECE suggests overconfidence or miscalibration. The AUROC metric measures the model's ability to distinguish between correct and incorrect answers. Higher AUROC indicates better discrimination.
The consistent challenges in mathematics and physics may be due to the need for precise reasoning and symbolic manipulation, which are areas where LLMs often struggle. The better performance in subjects like geography and government may be attributed to the availability of more textual data and the reliance on factual recall.
The heatmap allows for a nuanced understanding of LLM capabilities and limitations, informing model selection and highlighting areas for future research and development. The data suggests that while LLMs are becoming increasingly powerful, they are not yet universally competent across all domains. Further investigation into the reasons for subject-specific performance differences is warranted.