## Scatter Plot with Error Bars: AI Model Performance vs. Human Benchmark on MMLU
### Overview
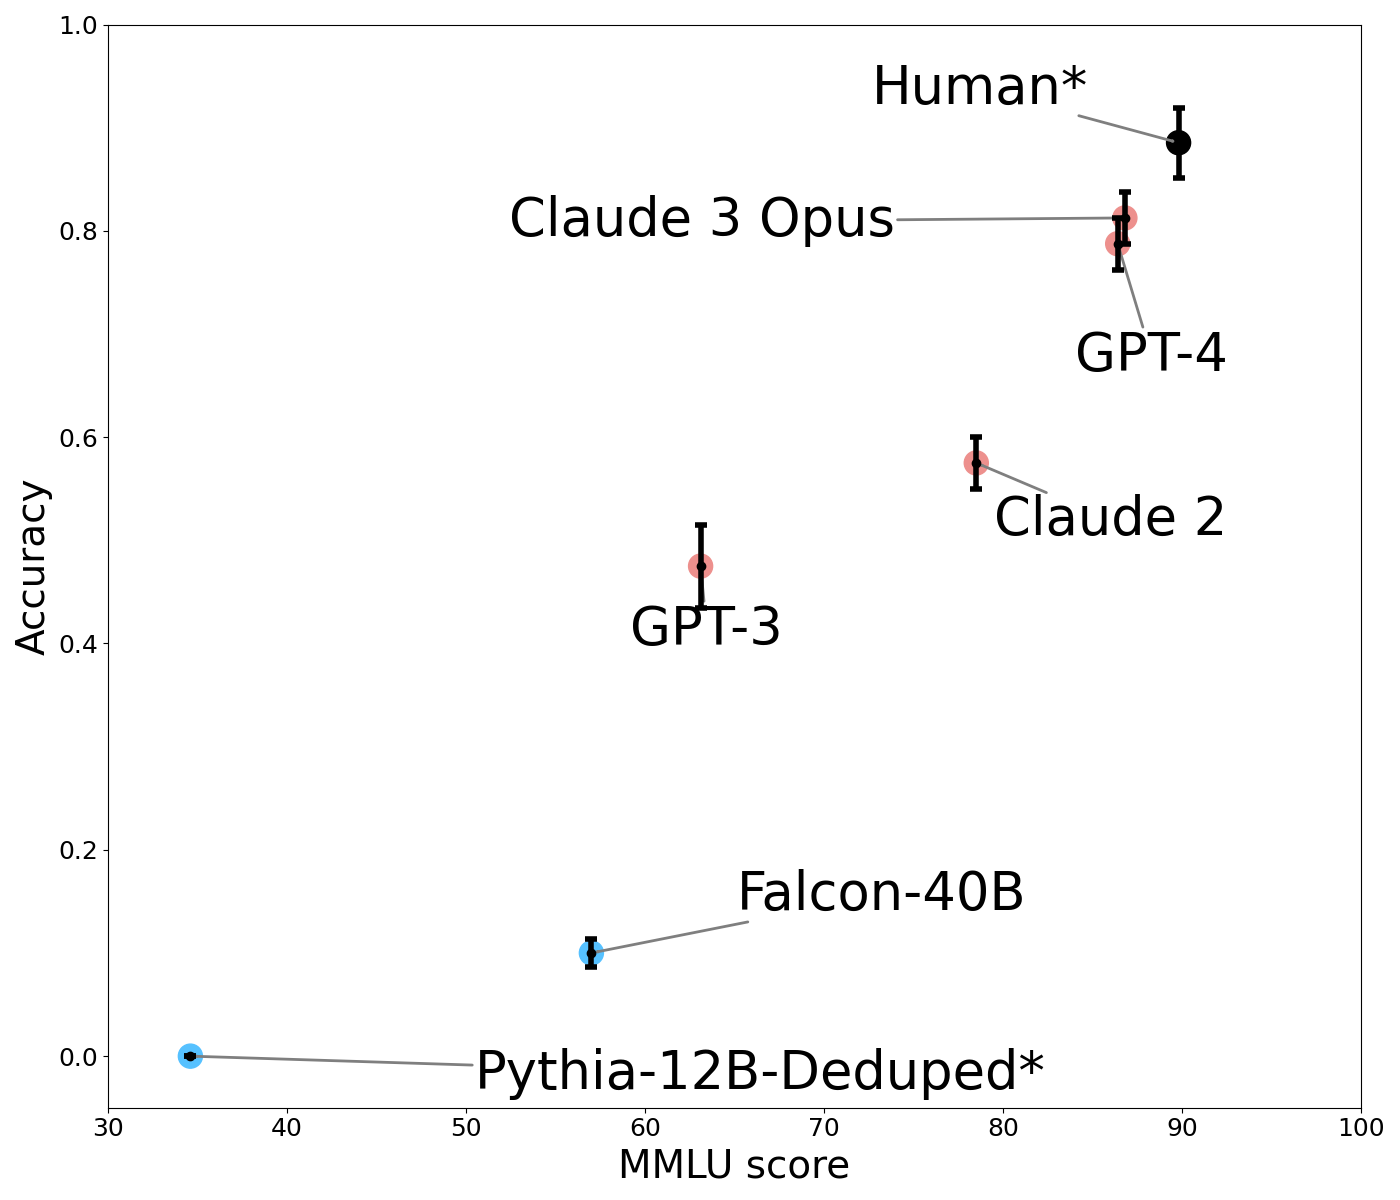
The image is a scatter plot comparing the performance of various large language models (LLMs) and a human benchmark on two metrics: "MMLU score" (x-axis) and "Accuracy" (y-axis). Each data point represents a model or human performance, accompanied by error bars indicating uncertainty. The plot demonstrates a positive correlation between MMLU score and accuracy.
### Components/Axes
* **X-Axis:** Labeled "MMLU score". Scale ranges from 30 to 100, with major tick marks at 30, 40, 50, 60, 70, 80, 90, and 100.
* **Y-Axis:** Labeled "Accuracy". Scale ranges from 0.0 to 1.0, with major tick marks at 0.0, 0.2, 0.4, 0.6, 0.8, and 1.0.
* **Data Series & Labels:** Seven distinct data points are plotted, each labeled directly on the chart. The labels are connected to their respective points by thin gray lines.
* **Pythia-12B-Deduped\*** (Blue point, bottom-left)
* **Falcon-40B** (Blue point, lower-middle)
* **GPT-3** (Red point, center)
* **Claude 2** (Red point, upper-middle right)
* **GPT-4** (Red point, upper-right)
* **Claude 3 Opus** (Red point, upper-right, slightly above GPT-4)
* **Human\*** (Black point, top-right)
* **Error Bars:** Vertical black bars extend above and below each data point, representing the range of uncertainty or variance for the "Accuracy" metric.
### Detailed Analysis
**Data Point Extraction (Approximate Values):**
| Model / Entity | MMLU Score (X) | Accuracy (Y) | Error Bar Range (Accuracy) | Point Color |
| :--- | :--- | :--- | :--- | :--- |
| Pythia-12B-Deduped* | ~35 | ~0.00 | Very small, near zero | Blue |
| Falcon-40B | ~57 | ~0.10 | ~0.08 to ~0.12 | Blue |
| GPT-3 | ~62 | ~0.47 | ~0.42 to ~0.52 | Red |
| Claude 2 | ~78 | ~0.57 | ~0.55 to ~0.60 | Red |
| GPT-4 | ~86 | ~0.79 | ~0.77 to ~0.82 | Red |
| Claude 3 Opus | ~87 | ~0.81 | ~0.79 to ~0.83 | Red |
| Human* | ~90 | ~0.88 | ~0.85 to ~0.91 | Black |
**Trend Verification:**
* The overall visual trend is a clear upward slope from the bottom-left to the top-right. As the MMLU score increases, the Accuracy score also increases.
* **Pythia-12B-Deduped*:** Positioned at the extreme bottom-left, showing near-zero accuracy with a low MMLU score.
* **Falcon-40B:** Shows a modest increase in both metrics compared to Pythia.
* **GPT-3:** Represents a significant jump in accuracy from the previous models.
* **Claude 2:** Continues the upward trend, positioned higher and to the right of GPT-3.
* **GPT-4 & Claude 3 Opus:** Clustered closely together in the upper-right quadrant, indicating high performance on both metrics. Claude 3 Opus is marginally higher in accuracy and MMLU score.
* **Human*:** Positioned as the top-right outlier, achieving the highest scores on both axes.
### Key Observations
1. **Performance Hierarchy:** The plot establishes a clear performance hierarchy: Human* > Claude 3 Opus ≈ GPT-4 > Claude 2 > GPT-3 > Falcon-40B > Pythia-12B-Deduped*.
2. **Model Generations:** The data visually groups models by generation or capability tier. The latest models (Claude 3 Opus, GPT-4) are clustered near human performance, while older models (GPT-3, Falcon-40B) are significantly lower.
3. **Error Bar Variance:** The length of the error bars varies. GPT-3 has a notably wider error bar in accuracy compared to others like Claude 2 or GPT-4, suggesting greater uncertainty or variance in its performance on this specific evaluation.
4. **Color Coding:** Models are color-coded. The two lowest-performing models (Pythia, Falcon) are blue. The mid-to-high performing AI models (GPT-3, Claude 2, GPT-4, Claude 3 Opus) are red. The human benchmark is uniquely black.
### Interpretation
This chart illustrates the rapid advancement of AI language models on the MMLU (Massive Multitask Language Understanding) benchmark, a standard test of broad knowledge and problem-solving. The strong positive correlation between MMLU score and Accuracy suggests that performance on this benchmark is a reliable predictor of general accuracy in the evaluated tasks.
The key takeaway is the closing gap between top-tier AI models and human performance. Claude 3 Opus and GPT-4 operate at approximately 90% of the human accuracy level shown here, marking a significant milestone. The asterisk (*) on "Human*" and "Pythia-12B-Deduped*" likely denotes a specific condition or footnote not visible in the image (e.g., "Human" may represent an average of expert performance, and "Deduped" refers to a data deduplication process for the Pythia model).
The plot serves as a snapshot of the competitive landscape in AI development as of the data's collection, highlighting both the achievements of leading models and the remaining margin to reach and surpass human-level performance on this comprehensive benchmark.