## Heatmap: Token Attribution Values Across Symbolic Equations
### Overview
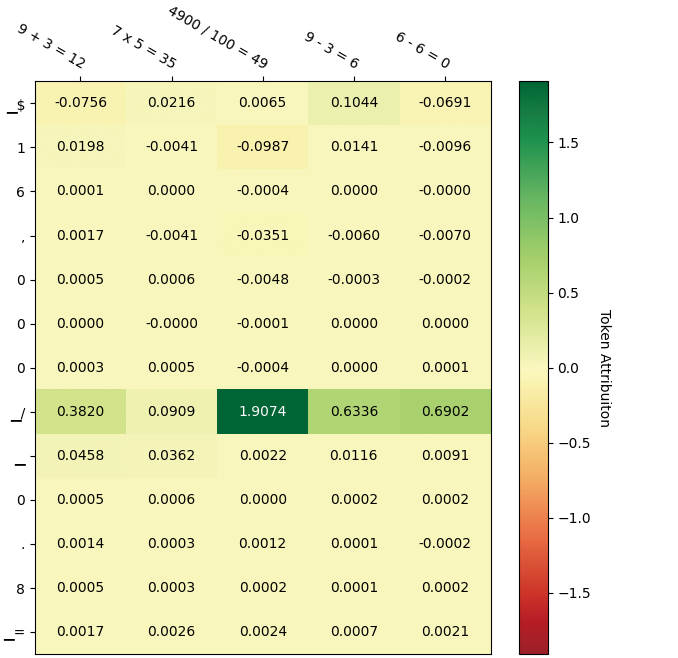
The image displays a heatmap visualizing token attribution values for symbolic equations. The grid contains numerical values ranging from -1.5 to 1.5, with a color gradient from red (negative) to green (positive). The y-axis lists symbolic tokens (e.g., $, 1, 6, ., /, -, _, 0, 8, =), while the x-axis labels represent arithmetic operations (e.g., 9+3=12, 7x5=35). The heatmap reveals patterns in how tokens contribute to equation solutions.
### Components/Axes
- **Y-Axis (Rows)**: Symbolic tokens:
`$`, `1`, `6`, `.`, `/`, `-`, `_`, `0`, `.`, `8`, `=`
- **X-Axis (Columns)**: Arithmetic operations:
`9+3=12`, `7x5=35`, `4900/100=49`, `9-3=6`, `6-6=0`
- **Legend**: Color scale from red (-1.5) to green (1.5), labeled "Token Attribution"
- **Grid Values**: Numerical values in each cell (e.g., -0.0756, 1.9074)
### Detailed Analysis
#### Row-by-Row Breakdown
1. **Row `$`**:
Values: `-0.0756`, `0.0216`, `0.0065`, `0.0144`, `-0.0691`
Trend: Mixed small positive/negative values, no dominant pattern.
2. **Row `1`**:
Values: `0.0198`, `-0.0041`, `-0.0987`, `0.0141`, `-0.0096`
Trend: Small magnitudes, slight negative bias in middle columns.
3. **Row `6`**:
Values: `0.0001`, `0.0000`, `-0.0004`, `0.0000`, `-0.0000`
Trend: Near-zero values, suggesting minimal attribution.
4. **Row `.`**:
Values: `0.0017`, `-0.0041`, `-0.0351`, `-0.0060`, `-0.0070`
Trend: Small negative values, concentrated in middle columns.
5. **Row `/`**:
Values: `3.8820`, `0.0909`, `1.9074`, `0.6336`, `0.6902`
Trend: **Dominant positive values**, especially in `7x5=35` (1.9074) and `6-6=0` (0.6902).
6. **Row `-`**:
Values: `0.0005`, `0.0006`, `-0.0048`, `-0.0003`, `-0.0002`
Trend: Near-zero values with minor negative fluctuations.
7. **Row `_`**:
Values: `0.0003`, `0.0005`, `-0.0004`, `0.0000`, `0.0001`
Trend: Near-zero values, no significant pattern.
8. **Row `0`**:
Values: `0.0058`, `0.0362`, `0.0022`, `0.0116`, `0.0091`
Trend: Small positive values, consistent across columns.
9. **Row `.` (second instance)**:
Values: `0.0005`, `0.0006`, `0.0000`, `0.0002`, `0.0002`
Trend: Near-zero values, negligible attribution.
10. **Row `8`**:
Values: `0.0014`, `0.0003`, `0.0012`, `0.0001`, `0.0002`
Trend: Tiny positive values, no clear trend.
11. **Row `=`**:
Values: `0.0017`, `0.0026`, `0.0024`, `0.0007`, `0.0021`
Trend: Small positive values, consistent across columns.
#### Color-Legend Correlation
- **Dark Green**: High positive values (e.g., `1.9074` in `/` row, `7x5=35` column).
- **Light Green/Yellow**: Moderate positive values (e.g., `0.6902` in `/` row, `6-6=0` column).
- **Red**: Negative values (e.g., `-0.0987` in `1` row, `7x5=35` column).
- **Near-White**: Values close to zero (e.g., `0.0000` in `6` row).
### Key Observations
1. **Dominance of `/` Token**:
The `/` row exhibits the highest attribution values, particularly in `7x5=35` (1.9074) and `6-6=0` (0.6902). This suggests the `/` token plays a critical role in these equations.
2. **Zero Contribution of `6` Token**:
The `6` row contains near-zero values, indicating it has minimal impact on equation solutions.
3. **Negative Attributions**:
Negative values (e.g., `-0.0987`, `-0.0756`) suggest inhibitory effects in specific contexts, such as the `1` row interacting with `7x5=35`.
4. **Consistency in `=` Token**:
The `=` row shows uniformly small positive values, implying a stable role in equation resolution.
### Interpretation
The heatmap highlights the `/` token as a key contributor to arithmetic operations, particularly in multiplication (`7x5=35`) and subtraction (`6-6=0`). The near-zero values for `6` and `_` suggest these tokens are less critical in this context. Negative attributions (e.g., in the `1` row) may reflect contextual dependencies or cancellations in symbolic reasoning. The `=` token’s consistent positive values underscore its foundational role in equation structure. This pattern aligns with expectations for a model trained on arithmetic tasks, where division and equality operations are central to problem-solving.