## CDF Chart: Rollbacks per Verification Window
### Overview
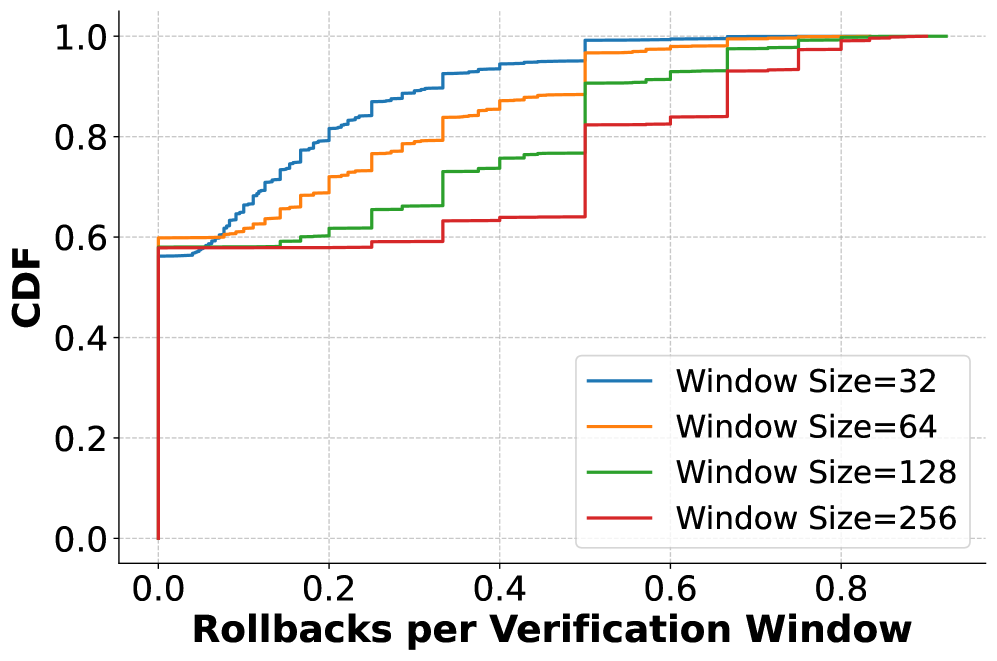
The chart displays cumulative distribution functions (CDFs) for rollbacks per verification window across four window sizes: 32, 64, 128, and 256. The x-axis represents "Rollbacks per Verification Window" (0.0–0.8), and the y-axis represents "CDF" (0.0–1.0). Each line corresponds to a window size, with larger windows requiring more rollbacks to reach higher CDF values.
### Components/Axes
- **Y-Axis (CDF)**: Labeled "CDF" with ticks at 0.0, 0.2, 0.4, 0.6, 0.8, 1.0.
- **X-Axis (Rollbacks per Verification Window)**: Labeled "Rollbacks per Verification Window" with ticks at 0.0, 0.2, 0.4, 0.6, 0.8.
- **Legend**: Located in the bottom-right corner, mapping colors to window sizes:
- Blue: Window Size = 32
- Orange: Window Size = 64
- Green: Window Size = 128
- Red: Window Size = 256
### Detailed Analysis
1. **Window Size = 32 (Blue Line)**:
- Starts at (0.0, 0.6) and rises sharply.
- Reaches 1.0 CDF at approximately **0.2 rollbacks**.
- Stepwise increases indicate discrete probability thresholds.
2. **Window Size = 64 (Orange Line)**:
- Begins at (0.0, 0.6) and rises more gradually than the blue line.
- Reaches 1.0 CDF at approximately **0.4 rollbacks**.
- Intermediate steps suggest slower accumulation of rollback tolerance.
3. **Window Size = 128 (Green Line)**:
- Starts at (0.0, 0.6) and rises even more gradually.
- Reaches 1.0 CDF at approximately **0.6 rollbacks**.
- Flatter steps reflect reduced sensitivity to rollbacks.
4. **Window Size = 256 (Red Line)**:
- Begins at (0.0, 0.6) and rises most gradually.
- Reaches 1.0 CDF at approximately **0.8 rollbacks**.
- Nearly linear progression indicates minimal rollback impact.
### Key Observations
- **Inverse Relationship**: Larger window sizes require more rollbacks to achieve the same CDF (e.g., 256 requires ~0.8 rollbacks vs. 32’s ~0.2).
- **Stepwise Behavior**: All lines exhibit step functions, typical of CDFs, with abrupt transitions between probability thresholds.
- **Consistency**: All lines start at (0.0, 0.6), suggesting a baseline CDF of 60% at zero rollbacks.
### Interpretation
The chart demonstrates that **larger verification windows are less sensitive to rollbacks**, requiring significantly more rollbacks to achieve the same confidence level (CDF). For example:
- A window size of 32 achieves 100% CDF with only ~0.2 rollbacks, while a window size of 256 requires ~0.8 rollbacks.
- This implies that systems using larger windows may tolerate more rollbacks before reaching full confidence, which could be critical for fault tolerance or reliability analysis. The stepwise nature of the CDFs suggests discrete event modeling, possibly reflecting probabilistic thresholds in system behavior.