\n
## Diagram: Complex Systems Analysis - 8-Counter & State Transitions
### Overview
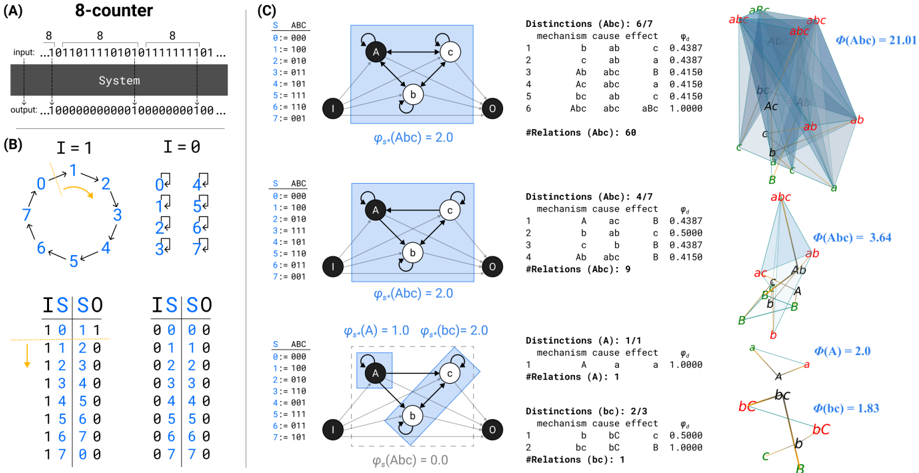
The image presents a complex diagram analyzing an 8-counter system. It combines elements of a state diagram, a truth table, and network visualizations to illustrate state transitions, distinctions between states, and associated probabilities. The diagram is divided into sections labeled (A), (B), and (C), each focusing on a different aspect of the system.
### Components/Axes
The diagram consists of the following components:
* **(A) 8-Counter:** Shows the input and output of an 8-counter system. The input is a repeating binary sequence, and the output is a longer binary sequence.
* **(B) I=1 & I=0 State Diagrams:** Two state diagrams representing the system's behavior when the input is 1 and 0, respectively. Each diagram has 7 states numbered 1-7.
* **(C) Network Visualizations & State Distinctions:** Three network visualizations, each representing a different state configuration (S). Each visualization includes a table listing distinctions between states (labeled 'Distinctions (Abc)'), mechanisms, cause effects, and the number of relations. Each network visualization is accompanied by a probability value (Φ(Abc)).
* **Tables:** Several tables displaying binary values, likely representing state transitions or system outputs.
### Detailed Analysis or Content Details
**Section (A) - 8-Counter:**
* **Input:** The input sequence is approximately ".1011101110111101...".
* **Output:** The output sequence is approximately "...0000000001000000100...".
**Section (B) - I=1 & I=0 State Diagrams:**
* **I=1 Diagram:**
* State 1 transitions to State 2.
* State 2 transitions to State 3.
* State 3 transitions to State 4.
* State 4 transitions to State 5.
* State 5 transitions to State 6.
* State 6 transitions to State 7.
* State 7 transitions to State 1.
* **I=0 Diagram:**
* State 1 transitions to State 2.
* State 2 transitions to State 3.
* State 3 transitions to State 4.
* State 4 transitions to State 5.
* State 5 transitions to State 6.
* State 6 transitions to State 7.
* State 7 transitions to State 1.
**Section (C) - Network Visualizations & State Distinctions:**
* **Top Network Visualization:**
* S: 000
* Distinctions (Abc): 6/7
* Mechanism: cause effect
* Effect: 0.4387, 0.4387, 0.4156, 0.4156, 0.4156, 1.0000
* #Relations (Abc): 60
* Φ(Abc) = 21.01
* **Middle Network Visualization:**
* S: 100
* Distinctions (Abc): 4/7
* Mechanism: cause effect
* Effect: 0.4387, 0.5000, 0.5000, 0.4387
* #Relations (Abc): 9
* Φ(Abc) = 3.64
* **Bottom Network Visualization (Two Sub-Visualizations):**
* **Left Sub-Visualization:**
* S: 010
* Distinctions (A): 1/1
* Mechanism: cause effect
* Effect: 1.0000
* #Relations (A): 1
* Φ(A) = 2.0
* **Right Sub-Visualization:**
* S: 110
* Distinctions (bc): 1/1
* Mechanism: cause effect
* Effect: 0.5000
* #Relations (bc): 1
* Φ(bc) = 2.0
**Tables (IS SO):**
* **Left Table (IS SO):**
| 1 | 0 | 1 | 1 |
|---|---|---|---|
| 1 | 1 | 2 | 0 |
| 1 | 3 | 0 | 0 |
| 1 | 5 | 6 | 0 |
| 1 | 6 | 7 | 0 |
* **Right Table (IS SO):**
| 0 | 0 | 0 | 0 |
|---|---|---|---|
| 0 | 2 | 3 | 0 |
| 0 | 4 | 5 | 0 |
| 0 | 6 | 7 | 0 |
| 0 | 0 | 0 | 0 |
### Key Observations
* The state diagrams in Section (B) are identical for I=1 and I=0, suggesting the system's state transitions are independent of the input value.
* The network visualizations in Section (C) show varying degrees of distinction between states, indicated by the "Distinctions" value.
* The probability values (Φ(Abc), Φ(A), Φ(bc)) differ significantly, suggesting varying levels of certainty or predictability associated with each state configuration.
* The tables labeled "IS SO" appear to represent a mapping between states or inputs and outputs, but the exact relationship is unclear without further context.
### Interpretation
The diagram appears to be analyzing a deterministic 8-counter system, where the state transitions are predictable regardless of the input. The network visualizations and associated probabilities likely represent a probabilistic model of the system's behavior, potentially derived from empirical data or simulations. The "Distinctions" values quantify the degree of difference between states, while the probability values indicate the confidence in the system's behavior within each state. The "IS SO" tables may represent a lookup table for determining the system's output based on its current state.
The high probability values in some of the network visualizations (e.g., Φ(Abc) = 21.01) suggest a strong correlation between the state configuration and the observed behavior. The lower probability values in others (e.g., Φ(Abc) = 3.64) may indicate a more complex or uncertain relationship. The diagram as a whole suggests a sophisticated analysis of a relatively simple system, aiming to uncover underlying patterns and probabilistic relationships. The use of network visualizations and probability values indicates a focus on understanding the system's behavior in terms of information flow and uncertainty.