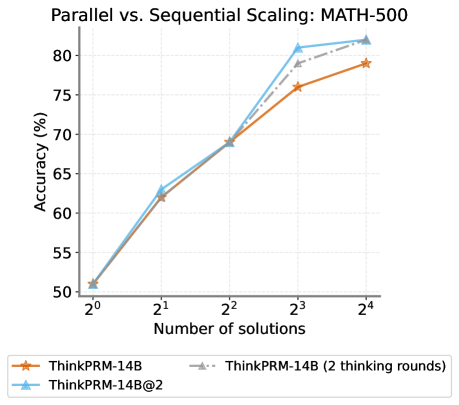
## Line Chart: Parallel vs. Sequential Scaling: MATH-500
### Overview
This is a line chart comparing the performance (accuracy) of three different model scaling approaches on the MATH-500 benchmark as the number of solutions increases. The chart demonstrates how accuracy scales with increased computational effort (number of solutions) for different methods.
### Components/Axes
* **Chart Title:** "Parallel vs. Sequential Scaling: MATH-500" (centered at the top).
* **Y-Axis:** Labeled "Accuracy (%)". The scale runs from 50 to 80, with major tick marks at intervals of 5 (50, 55, 60, 65, 70, 75, 80).
* **X-Axis:** Labeled "Number of solutions". The scale is logarithmic base 2, with markers at 2⁰ (1), 2¹ (2), 2² (4), 2³ (8), and 2⁴ (16).
* **Legend:** Positioned at the bottom center of the chart. It contains three entries:
1. **ThinkPRM-14B:** Represented by an orange solid line with star (★) markers.
2. **ThinkPRM-14B@2:** Represented by a light blue solid line with upward-pointing triangle (▲) markers.
3. **ThinkPRM-14B (2 thinking rounds):** Represented by a gray dashed line with upward-pointing triangle (▲) markers.
### Detailed Analysis
The chart plots three data series. All series show a positive correlation between the number of solutions and accuracy.
**1. ThinkPRM-14B (Orange Line, Star Markers):**
* **Trend:** Shows a steady, near-linear upward slope on this semi-log plot.
* **Data Points (Approximate):**
* At 2⁰ (1 solution): ~51%
* At 2¹ (2 solutions): ~62%
* At 2² (4 solutions): ~69%
* At 2³ (8 solutions): ~76%
* At 2⁴ (16 solutions): ~79%
**2. ThinkPRM-14B@2 (Blue Line, Triangle Markers):**
* **Trend:** Follows a similar initial trajectory to the orange line but exhibits a steeper increase between 2² and 2³, ultimately achieving the highest accuracy.
* **Data Points (Approximate):**
* At 2⁰ (1 solution): ~51% (overlaps with orange line)
* At 2¹ (2 solutions): ~63% (slightly above orange line)
* At 2² (4 solutions): ~69% (overlaps with orange line)
* At 2³ (8 solutions): ~81%
* At 2⁴ (16 solutions): ~82%
**3. ThinkPRM-14B (2 thinking rounds) (Gray Dashed Line, Triangle Markers):**
* **Trend:** This series is only plotted from 2² onward. It starts at the same point as the other two at 2² and follows a path between the orange and blue lines, ending very close to the blue line.
* **Data Points (Approximate):**
* At 2² (4 solutions): ~69% (overlaps with others)
* At 2³ (8 solutions): ~78% (between orange and blue)
* At 2⁴ (16 solutions): ~81% (very close to blue line)
### Key Observations
1. **Convergence at Low Compute:** All three methods start at nearly identical accuracy (~51%) with a single solution (2⁰).
2. **Divergence at High Compute:** Performance begins to diverge significantly at 8 solutions (2³). The "ThinkPRM-14B@2" (blue) method shows a clear advantage, jumping to ~81%, while the base "ThinkPRM-14B" (orange) is at ~76%.
3. **Diminishing Returns:** The slope of all lines begins to flatten between 8 (2³) and 16 (2⁴) solutions, indicating diminishing returns in accuracy for additional solutions in this range.
4. **Effect of "Thinking Rounds":** The gray dashed line suggests that adding "2 thinking rounds" to the base model improves its scaling performance, bringing it close to the "ThinkPRM-14B@2" method at 16 solutions.
### Interpretation
The data demonstrates the principle of **scaling laws** for reasoning models on mathematical problems. Increasing the number of solutions (a form of parallel compute or sampling) reliably improves accuracy.
The key finding is the comparison between scaling methods. "ThinkPRM-14B@2" (likely a form of parallel scaling or ensemble) outperforms the standard "ThinkPRM-14B" (likely sequential scaling) at higher compute budgets (8+ solutions). This suggests that parallel strategies may be more efficient for leveraging additional compute to solve difficult problems.
The "2 thinking rounds" variant acts as an intermediate, showing that enhancing the sequential reasoning process (more "thinking") can also close the gap with parallel methods, but the parallel approach still holds a slight edge at the highest measured compute point (16 solutions). The flattening curves at 16 solutions imply that for this specific benchmark and model size, simply adding more solutions yields progressively smaller gains, and further improvements may require architectural changes or significantly more compute.