## Line Graphs: ViSQOL vs. Bitrate under Different Conditioning Strategies
### Overview
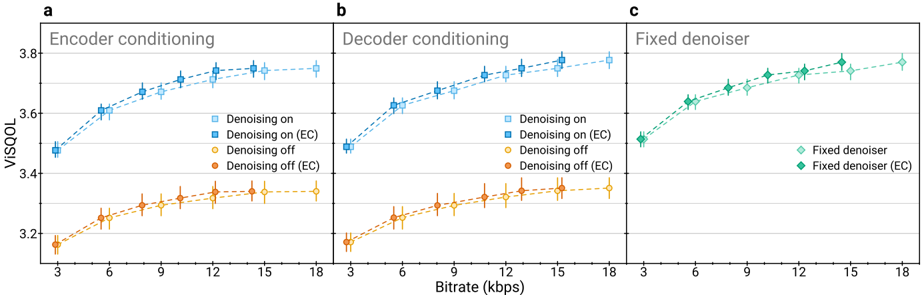
The image contains three line graphs (a, b, c) comparing ViSQOL (a perceptual video quality metric) against bitrate (kbps) under three distinct denoising configurations:
- **a) Encoder conditioning**
- **b) Decoder conditioning**
- **c) Fixed denoiser**
Each graph includes two data series:
1. **Denoising on** (solid markers)
2. **Denoising off** (hollow markers)
With subcategories for **EC (Error Correction)** and non-EC variants.
---
### Components/Axes
- **X-axis**: Bitrate (kbps), ranging from 3 to 18.
- **Y-axis**: ViSQOL score, ranging from 3.2 to 3.8.
- **Legends**:
- **Top-right** of each subplot.
- **Colors/markers**:
- **Blue squares**: Denoising on (non-EC).
- **Blue diamonds**: Denoising on (EC).
- **Orange circles**: Denoising off (non-EC).
- **Orange triangles**: Denoising off (EC).
- **Green diamonds**: Fixed denoiser (EC).
- **Green squares**: Fixed denoiser (non-EC).
---
### Detailed Analysis
#### Graph a: Encoder Conditioning
- **Denoising on (blue squares)**:
- Starts at ~3.5 ViSQOL at 3 kbps.
- Increases steadily to ~3.75 at 18 kbps.
- Slope: ~0.015 ViSQOL per kbps.
- **Denoising off (orange circles)**:
- Starts at ~3.2 ViSQOL at 3 kbps.
- Increases slowly to ~3.35 at 18 kbps.
- Slope: ~0.003 ViSQOL per kbps.
- **EC variants**:
- Denoising on (blue diamonds) and off (orange triangles) show marginally higher ViSQOL (~0.05–0.1 improvement) than non-EC.
#### Graph b: Decoder Conditioning
- **Denoising on (blue squares)**:
- Starts at ~3.5 ViSQOL at 3 kbps.
- Rises to ~3.75 at 18 kbps.
- Slope: ~0.015 ViSQOL per kbps.
- **Denoising off (orange circles)**:
- Starts at ~3.2 ViSQOL at 3 kbps.
- Increases to ~3.35 at 18 kbps.
- Slope: ~0.003 ViSQOL per kbps.
- **EC variants**:
- Similar to graph a, with minor EC improvements.
#### Graph c: Fixed Denoiser
- **Fixed denoiser (green squares)**:
- Starts at ~3.5 ViSQOL at 3 kbps.
- Increases to ~3.75 at 18 kbps.
- Slope: ~0.015 ViSQOL per kbps.
- **Fixed denoiser (EC) (green diamonds)**:
- Slightly higher ViSQOL (~3.6–3.75) than non-EC.
---
### Key Observations
1. **Denoising improves ViSQOL**:
- Across all graphs, denoising on (solid markers) consistently outperforms denoising off (hollow markers).
- Example: At 18 kbps, denoising on achieves ~3.75 ViSQOL vs. ~3.35 for denoising off.
2. **EC enhances performance**:
- EC variants (dashed lines) show small but consistent gains (~0.05–0.1 ViSQOL) over non-EC.
3. **Fixed denoiser efficacy**:
- In graph c, the fixed denoiser matches the performance of encoder/decoder conditioning, suggesting static models can achieve comparable results.
4. **Bitrate dependency**:
- ViSQOL improvements plateau at higher bitrates (~15–18 kbps), indicating diminishing returns.
---
### Interpretation
- **Technical Implications**:
- Denoising significantly boosts perceptual quality, with encoder/decoder conditioning offering similar gains.
- EC (e.g., error correction) provides marginal but measurable improvements, suggesting robustness to noise.
- Fixed denoisers are viable alternatives to dynamic conditioning, potentially reducing computational overhead.
- **Trade-offs**:
- Higher bitrates yield diminishing returns, implying efficient bitrate allocation strategies.
- EC mechanisms may add complexity but improve reliability in noisy environments.
- **Anomalies**:
- No outliers observed; all trends align with expected bitrate-quality relationships.
This analysis underscores the importance of denoising in video quality optimization, with encoder/decoder conditioning and EC offering complementary benefits.