## Chart: CIFAR-100 Test Accuracy vs. d1
### Overview
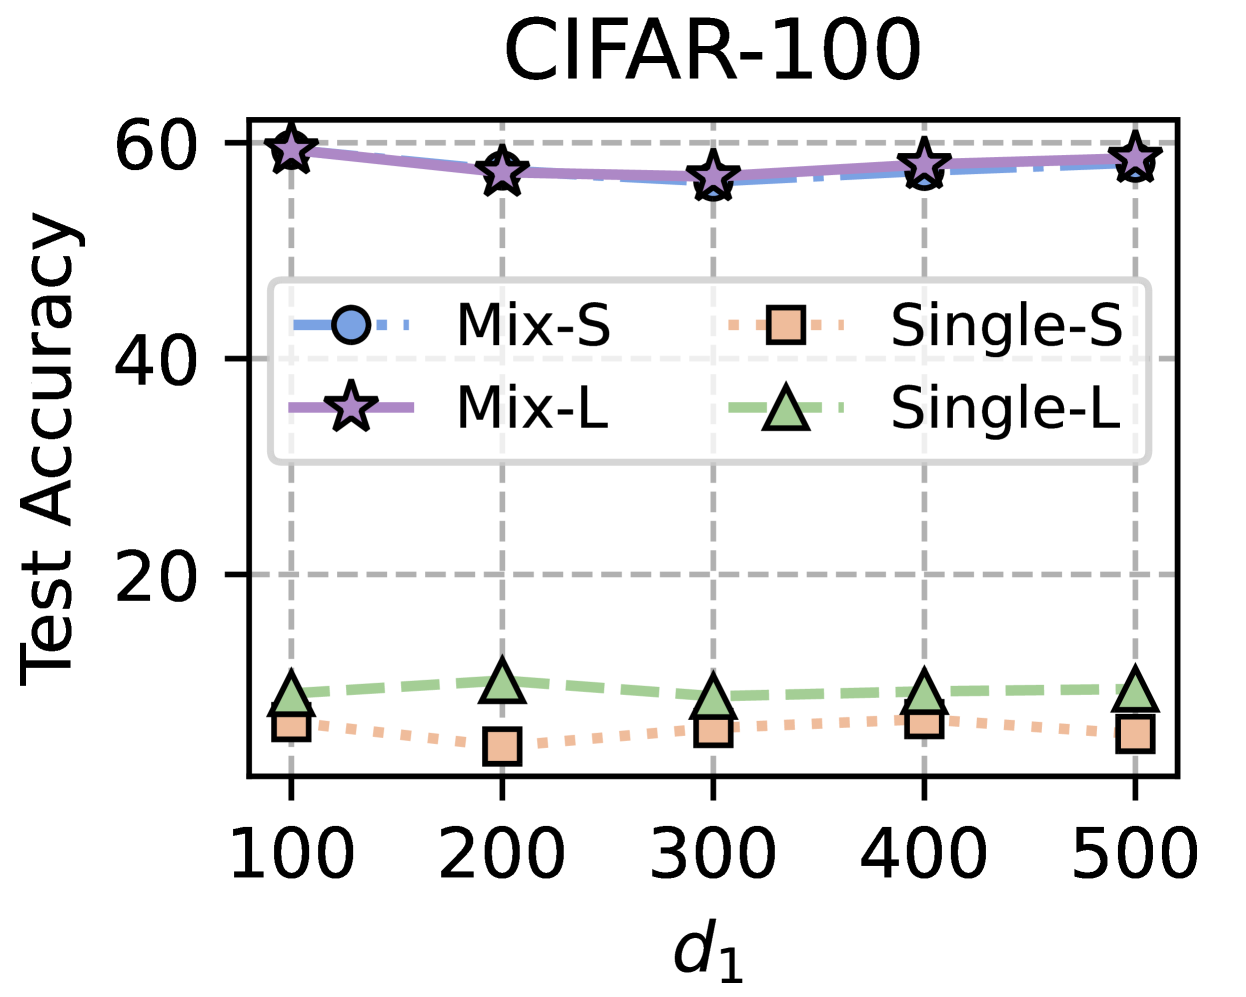
The image is a line chart comparing the test accuracy of different models (Mix-S, Mix-L, Single-S, Single-L) on the CIFAR-100 dataset, plotted against the variable 'd1'. The chart displays the performance of these models across different values of 'd1' (100, 200, 300, 400, 500).
### Components/Axes
* **Title:** CIFAR-100
* **X-axis:** d1, with markers at 100, 200, 300, 400, and 500.
* **Y-axis:** Test Accuracy, ranging from 0 to 60, with markers at 20, 40, and 60.
* **Legend:** Located in the top-right quadrant of the chart.
* Mix-S (light blue line with circle markers)
* Mix-L (light purple line with star markers)
* Single-S (light orange dotted line with square markers)
* Single-L (light green dashed line with triangle markers)
### Detailed Analysis
* **Mix-S (light blue, circle markers):** The line is relatively flat, showing a slight decrease from d1=100 to d1=200, then remains stable.
* d1=100: Accuracy ≈ 59
* d1=200: Accuracy ≈ 58
* d1=300: Accuracy ≈ 58
* d1=400: Accuracy ≈ 58
* d1=500: Accuracy ≈ 58
* **Mix-L (light purple, star markers):** The line is relatively flat, showing a slight decrease from d1=100 to d1=200, then remains stable.
* d1=100: Accuracy ≈ 60
* d1=200: Accuracy ≈ 58
* d1=300: Accuracy ≈ 58
* d1=400: Accuracy ≈ 58
* d1=500: Accuracy ≈ 59
* **Single-S (light orange, square markers):** The line is relatively flat, showing a slight increase from d1=100 to d1=200, then remains stable.
* d1=100: Accuracy ≈ 7
* d1=200: Accuracy ≈ 6
* d1=300: Accuracy ≈ 7
* d1=400: Accuracy ≈ 7
* d1=500: Accuracy ≈ 7
* **Single-L (light green, triangle markers):** The line is relatively flat, showing a slight increase from d1=100 to d1=200, then remains stable.
* d1=100: Accuracy ≈ 9
* d1=200: Accuracy ≈ 11
* d1=300: Accuracy ≈ 9
* d1=400: Accuracy ≈ 8
* d1=500: Accuracy ≈ 9
### Key Observations
* The "Mix-S" and "Mix-L" models significantly outperform the "Single-S" and "Single-L" models in terms of test accuracy.
* The test accuracy for "Mix-S" and "Mix-L" models is relatively stable across different values of 'd1'.
* The test accuracy for "Single-S" and "Single-L" models is also relatively stable across different values of 'd1'.
* The "Mix-L" model has a slightly higher test accuracy than the "Mix-S" model.
* The "Single-L" model has a slightly higher test accuracy than the "Single-S" model.
### Interpretation
The chart suggests that the "Mix" models (Mix-S and Mix-L) are more effective than the "Single" models (Single-S and Single-L) for the CIFAR-100 dataset, regardless of the 'd1' value. The stability of the lines indicates that the performance of these models is not significantly affected by changes in 'd1' within the tested range. The slight advantage of "Mix-L" over "Mix-S" and "Single-L" over "Single-S" might be due to differences in model architecture or training parameters. The consistent, low performance of the "Single" models suggests they may be underfitting the data or lack the capacity to capture the complexity of the CIFAR-100 dataset.