## Chart: Zoomed-in ROC Curve (Log-scaled FPR)
### Overview
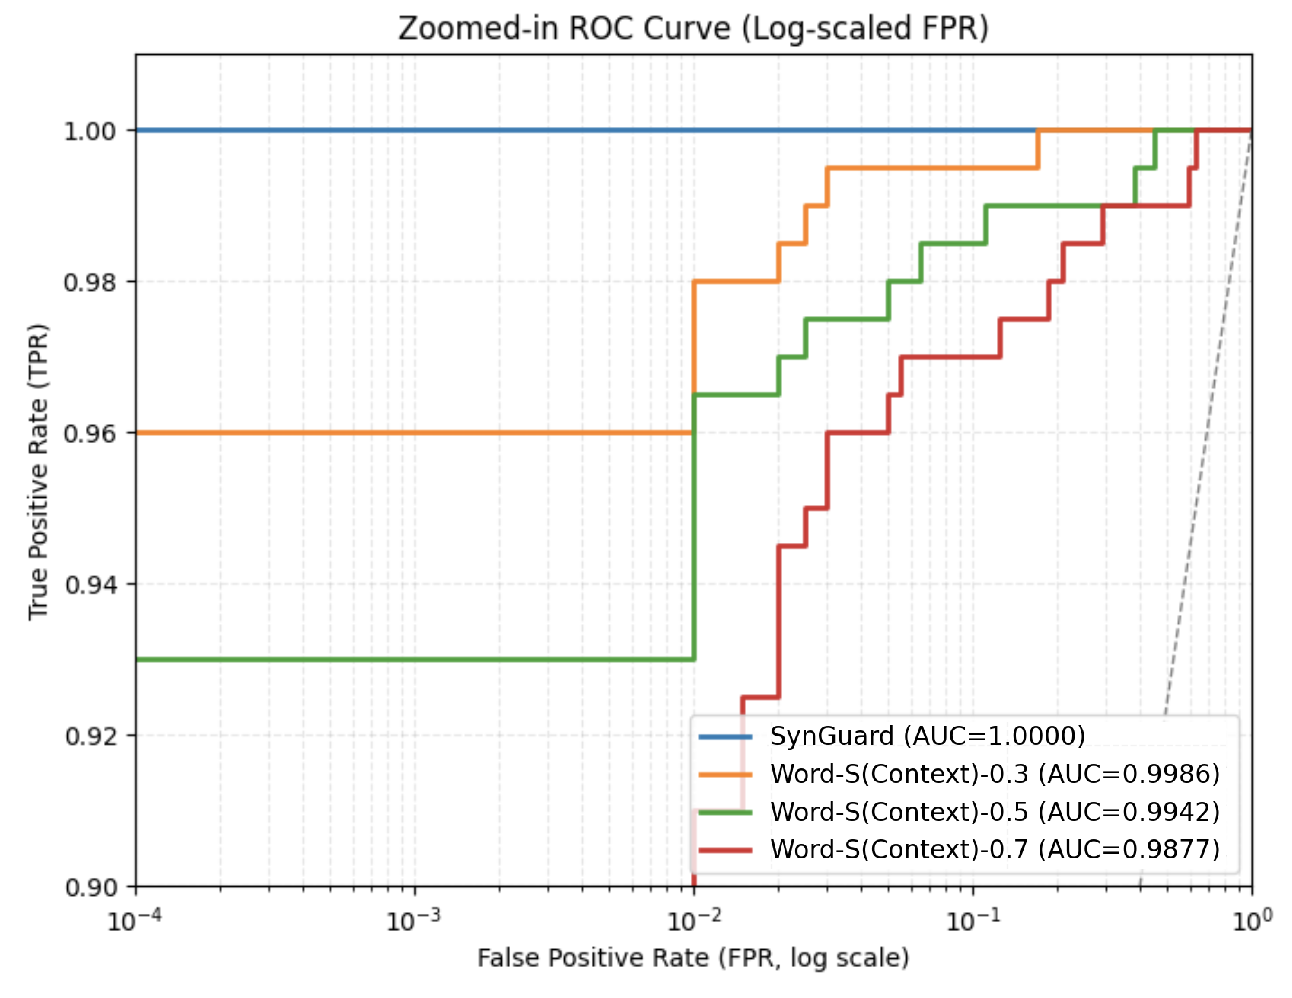
The image presents a Receiver Operating Characteristic (ROC) curve, specifically a zoomed-in view with the False Positive Rate (FPR) displayed on a logarithmic scale. The chart compares the performance of several models or configurations, indicated by different colored lines, based on their True Positive Rate (TPR) versus FPR. The Area Under the Curve (AUC) is provided for each line.
### Components/Axes
* **Title:** "Zoomed-in ROC Curve (Log-scaled FPR)" - positioned at the top-center.
* **X-axis:** "False Positive Rate (FPR, log scale)" - ranging from 10<sup>-4</sup> to 10<sup>0</sup> (i.e., 0.1 to 1). The scale is logarithmic.
* **Y-axis:** "True Positive Rate (TPR)" - ranging from 0.90 to 1.00.
* **Legend:** Located in the bottom-right corner. It identifies the following lines and their corresponding AUC values:
* SynGuard (Blue) - AUC = 1.0000
* Word-S(Context)-0.3 (Orange) - AUC = 0.9986
* Word-S(Context)-0.5 (Yellow) - AUC = 0.9942
* Word-S(Context)-0.7 (Green) - AUC = 0.9877
* **Gridlines:** Light gray, providing a background grid for easier value estimation.
### Detailed Analysis
The chart displays four ROC curves. Let's analyze each one:
1. **SynGuard (Blue):** This line is nearly horizontal at a TPR of approximately 1.00 across the entire FPR range. This indicates perfect or near-perfect separation between positive and negative classes.
* FPR = 10<sup>-4</sup>: TPR ≈ 1.00
* FPR = 10<sup>-3</sup>: TPR ≈ 1.00
* FPR = 10<sup>-2</sup>: TPR ≈ 1.00
* FPR = 10<sup>-1</sup>: TPR ≈ 1.00
* FPR = 10<sup>0</sup>: TPR ≈ 1.00
2. **Word-S(Context)-0.3 (Orange):** This line starts at approximately TPR = 0.92 and rises sharply to TPR ≈ 0.98 at FPR ≈ 0.01. It then plateaus around TPR = 0.98-0.99 for higher FPR values.
* FPR = 10<sup>-4</sup>: TPR ≈ 0.92
* FPR = 10<sup>-3</sup>: TPR ≈ 0.96
* FPR = 10<sup>-2</sup>: TPR ≈ 0.98
* FPR = 10<sup>-1</sup>: TPR ≈ 0.99
* FPR = 10<sup>0</sup>: TPR ≈ 0.99
3. **Word-S(Context)-0.5 (Yellow):** This line starts at approximately TPR = 0.93 and rises more gradually than the orange line. It reaches TPR ≈ 0.97 at FPR ≈ 0.01 and continues to increase slowly.
* FPR = 10<sup>-4</sup>: TPR ≈ 0.93
* FPR = 10<sup>-3</sup>: TPR ≈ 0.95
* FPR = 10<sup>-2</sup>: TPR ≈ 0.97
* FPR = 10<sup>-1</sup>: TPR ≈ 0.98
* FPR = 10<sup>0</sup>: TPR ≈ 0.99
4. **Word-S(Context)-0.7 (Green):** This line starts at approximately TPR = 0.90 and exhibits the slowest rise among the four lines. It reaches TPR ≈ 0.95 at FPR ≈ 0.01 and continues to increase gradually.
* FPR = 10<sup>-4</sup>: TPR ≈ 0.90
* FPR = 10<sup>-3</sup>: TPR ≈ 0.93
* FPR = 10<sup>-2</sup>: TPR ≈ 0.95
* FPR = 10<sup>-1</sup>: TPR ≈ 0.97
* FPR = 10<sup>0</sup>: TPR ≈ 0.99
### Key Observations
* SynGuard significantly outperforms the other models, achieving a perfect AUC score of 1.00.
* As the context value in "Word-S(Context)-" increases from 0.3 to 0.7, the performance (AUC) decreases. This suggests that a context value of 0.3 provides the best balance between TPR and FPR for the Word-S model.
* The curves are relatively close together, indicating that all models have reasonably good performance, but SynGuard is substantially better.
* The logarithmic scale on the x-axis emphasizes the performance of the models at low FPR values, which is often the most critical region for many applications.
### Interpretation
The ROC curve demonstrates the trade-off between sensitivity (TPR) and specificity (1 - FPR) for each model. A higher AUC indicates better overall performance. SynGuard's AUC of 1.00 suggests it can perfectly distinguish between positive and negative cases. The Word-S models show a decreasing performance trend as the context value increases, implying that a smaller context window might be more effective for this particular task. The zoomed-in view on the log-scaled FPR highlights the models' ability to maintain high TPR while keeping FPR low, which is crucial for minimizing false alarms. The data suggests that SynGuard is the preferred model, while the optimal context value for the Word-S model is around 0.3. The choice of model and context value would depend on the specific application and the relative costs of false positives and false negatives.