## Line Chart: Accuracy vs. # Solutions per Problem
### Overview
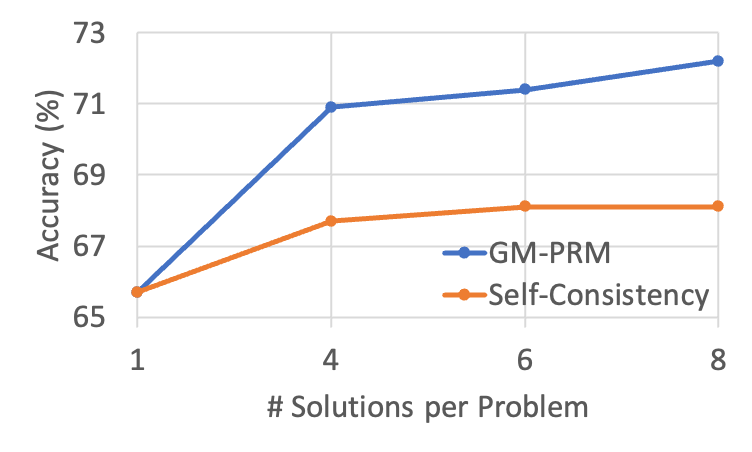
This image is a line chart comparing the performance of two methods, "GM-PRM" and "Self-Consistency," across varying numbers of solutions per problem. The chart demonstrates how accuracy changes as the number of solutions increases from 1 to 8.
### Components/Axes
* **X-Axis:** Labeled "# Solutions per Problem". The scale is non-linear, with discrete data points at 1, 4, 6, and 8.
* **Y-Axis:** Labeled "Accuracy (%)". The scale ranges from 65 to 73, with major grid lines at intervals of 2 (65, 67, 69, 71, 73).
* **Legend:** Located in the bottom-right quadrant of the chart area.
* **Blue Line (with circular markers):** Represents "GM-PRM".
* **Orange Line (with circular markers):** Represents "Self-Consistency".
### Detailed Analysis
The chart plots two data series. Below are the approximate values for each data point, estimated based on the grid lines.
**Trend Verification:**
* **GM-PRM (Blue Line):** The line slopes upward sharply between 1 and 4 solutions, then continues to slope upward at a more gradual rate between 4, 6, and 8 solutions.
* **Self-Consistency (Orange Line):** The line slopes upward between 1 and 4 solutions, shows a very slight increase between 4 and 6, and appears to plateau (remain flat) between 6 and 8 solutions.
**Data Points (Approximate Values):**
| # Solutions | GM-PRM (Blue) | Self-Consistency (Orange) |
| :--- | :--- | :--- |
| **1** | ~65.7% | ~65.7% |
| **4** | ~70.9% | ~67.7% |
| **6** | ~71.4% | ~68.1% |
| **8** | ~72.2% | ~68.1% |
*Note: Values are visual estimates based on the provided grid. There is an uncertainty of approximately ±0.2% due to the resolution of the chart.*
### Key Observations
* **Starting Point:** Both methods begin at the same accuracy level (~65.7%) when only 1 solution per problem is provided.
* **Divergence:** The two methods diverge significantly after the first data point. GM-PRM achieves a higher accuracy than Self-Consistency at every point beyond 1 solution.
* **Performance Ceiling:** The Self-Consistency method exhibits diminishing returns, with the accuracy curve flattening out completely between 6 and 8 solutions.
* **Scalability:** GM-PRM continues to show a positive trend in accuracy as the number of solutions increases to 8, suggesting it scales better with more computational effort than Self-Consistency.
### Interpretation
The data suggests that **GM-PRM is a more effective method** than Self-Consistency for tasks where multiple solutions per problem can be generated.
While both methods perform identically at the baseline (1 solution), GM-PRM leverages additional solutions more efficiently. The "Self-Consistency" method appears to hit a performance ceiling around 6 solutions, where adding more solutions yields negligible accuracy gains. In contrast, the GM-PRM method maintains a positive trajectory, indicating that it is better at filtering or aggregating information from a larger pool of solutions to improve final accuracy. This implies that if computational resources allow for generating 8 solutions, GM-PRM provides a distinct performance advantage over Self-Consistency.