\n
## Diagram: Rugged Energy Landscape & Phase States
### Overview
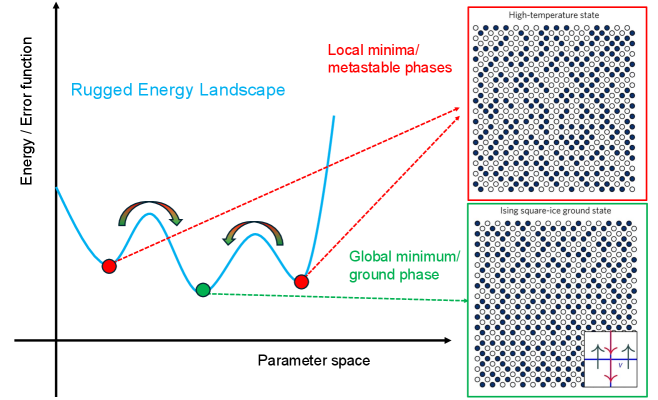
The image is a diagram illustrating a "Rugged Energy Landscape" and its relationship to different phases of a system, likely in the context of physics or machine learning. It depicts an energy/error function plotted against a parameter space, with visual representations of high-temperature and ground state configurations.
### Components/Axes
* **X-axis:** Labeled "Parameter space". No specific scale is indicated.
* **Y-axis:** Labeled "Energy / Error function". No specific scale is indicated.
* **Blue Curve:** Represents the energy landscape, showing local minima and a global minimum.
* **Red Line:** Represents a path to local minima/metastable phases.
* **Green Arrows:** Indicate movement towards local minima.
* **Red Dots:** Mark local minima points on the blue curve.
* **Green Dot:** Marks the global minimum point on the blue curve.
* **Text Labels:**
* "Rugged Energy Landscape" (Blue, top-left)
* "Local minima/ metastable phases" (Red, top-right)
* "Global minimum/ ground phase" (Green, bottom-right)
* **Phase State Illustrations (Right Side):**
* "High-temperature state" (Top) - A grid of circles, mostly blue with some white.
* "Ising square-ice ground state" (Bottom) - A grid of circles, mostly blue with some white, and an arrow diagram indicating spin alignment.
### Detailed Analysis or Content Details
The diagram shows a complex energy landscape with multiple local minima and one global minimum. The blue curve oscillates, creating several "valleys" (local minima) and a deep "valley" (global minimum).
* **Energy Landscape:** The blue curve starts at a relatively high energy level, descends to a local minimum, rises again, descends to another local minimum, and finally reaches a deeper global minimum. The curve is not smooth, indicating a "rugged" landscape.
* **Local Minima:** There are approximately three visible local minima, marked by red dots. The red line connects to these points, illustrating paths to these metastable states.
* **Global Minimum:** The global minimum is marked by a green dot and represents the lowest energy state.
* **Phase States:**
* **High-Temperature State:** The illustration shows a disordered arrangement of blue and white circles, suggesting high thermal energy and randomness.
* **Ising Square-Ice Ground State:** The illustration shows a more ordered arrangement of blue and white circles, with an arrow diagram indicating a preferred spin alignment (up/down). The arrow diagram shows two arrows pointing up and one arrow pointing down.
### Key Observations
* The rugged energy landscape implies that finding the global minimum is challenging, as the system can easily get trapped in local minima.
* The phase state illustrations demonstrate the difference between a disordered (high-temperature) state and an ordered (ground) state.
* The diagram visually represents the concept of energy minimization and the challenges associated with it.
### Interpretation
This diagram illustrates a common concept in physics and machine learning: the energy landscape. The landscape represents the possible states of a system and their corresponding energies. The goal is often to find the state with the lowest energy (the global minimum). However, the presence of local minima can hinder this process, as the system can get stuck in suboptimal states.
The phase state illustrations provide a visual representation of how the system's configuration changes as it transitions between different energy levels. The high-temperature state represents a disordered state with high energy, while the ground state represents an ordered state with low energy.
The diagram suggests that the system's behavior is heavily influenced by the shape of the energy landscape and the temperature. At high temperatures, the system is more likely to explore different states and overcome energy barriers, while at low temperatures, it is more likely to get trapped in local minima. The Ising square-ice ground state illustration suggests a system with magnetic properties and a preferred spin alignment.