## Diagram: Agent-Environment Interaction and Astrocyte Signaling Pathway
### Overview
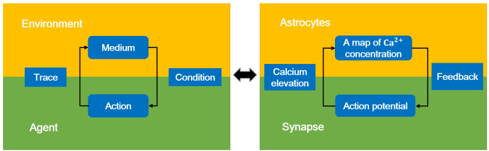
The image presents two interconnected diagrams illustrating (1) an agent-environment interaction model and (2) an astrocyte signaling pathway. Both diagrams use color-coded sections (yellow for "Environment"/"Astrocytes," green for "Agent"/"Synapse") and directional arrows to depict relationships between components.
### Components/Axes
#### Left Diagram (Environment):
- **Sections**:
- **Yellow (Environment)**: Contains "Trace" (top-left) and "Medium" (center).
- **Green (Agent)**: Contains "Action" (bottom-right).
- **Labels**:
- "Trace" → "Medium" → "Condition" → "Action" (flow sequence).
- Arrows indicate bidirectional interaction between "Medium" and "Condition."
#### Right Diagram (Astrocytes):
- **Sections**:
- **Yellow (Astrocytes)**: Contains "A map of Ca²⁺ concentration" (top-center).
- **Green (Synapse)**: Contains "Action potential" (bottom-center) and "Feedback" (top-right).
- **Labels**:
- "A map of Ca²⁺ concentration" → "Calcium elevation" → "Action potential" → "Feedback."
- Feedback loop connects "Feedback" back to "A map of Ca²⁺ concentration."
### Detailed Analysis
- **Environment Diagram**:
- "Trace" (likely a sensory input) interacts with "Medium" (environmental context), which influences "Condition" (external state).
- "Condition" triggers "Action" (agent response).
- No numerical data; focuses on abstract causal relationships.
- **Astrocyte Diagram**:
- "A map of Ca²⁺ concentration" (calcium ion distribution) drives "Calcium elevation" (increased intracellular Ca²⁺).
- Calcium elevation generates "Action potential" (electrical signal).
- "Feedback" modulates the original Ca²⁺ concentration map, suggesting homeostatic regulation.
### Key Observations
1. **Bidirectional Flow**: Both diagrams emphasize feedback loops (e.g., "Feedback" in astrocytes, bidirectional arrows in the environment model).
2. **Color Coding**: Yellow/green sections spatially separate "external" (environment/astrocyte) and "internal" (agent/synapse) components.
3. **No Numerical Data**: The diagrams are conceptual, lacking quantitative values or scales.
### Interpretation
The diagrams highlight two interconnected systems:
1. **Agent-Environment Interaction**: Demonstrates how agents perceive environmental traces, process conditions, and execute actions. The feedback between "Medium" and "Condition" suggests dynamic adaptation to environmental changes.
2. **Astrocyte Signaling**: Illustrates calcium-dependent synaptic regulation. Calcium elevation in astrocytes triggers action potentials, which in turn regulate Ca²⁺ levels via feedback, emphasizing cellular homeostasis.
The connection between the two diagrams implies that environmental conditions (left) may influence astrocyte signaling (right), linking external stimuli to intracellular calcium dynamics and synaptic activity. This could represent a model for how external signals modulate neural communication through glial cell activity.