TECHNICAL ASSET FINGERPRINT
0adfbdaa1c991a3512f7ac60
Click to view fullscreen
Press ESC or click to close
FOUND IN PAPERS
EXPERT: healer-alpha-free VERSION 1
RUNTIME: free/openrouter/healer-alpha
INTEL_VERIFIED
## Diagram: System Architecture for Model-Based Reinforcement Learning with Experience Feedback
### Overview
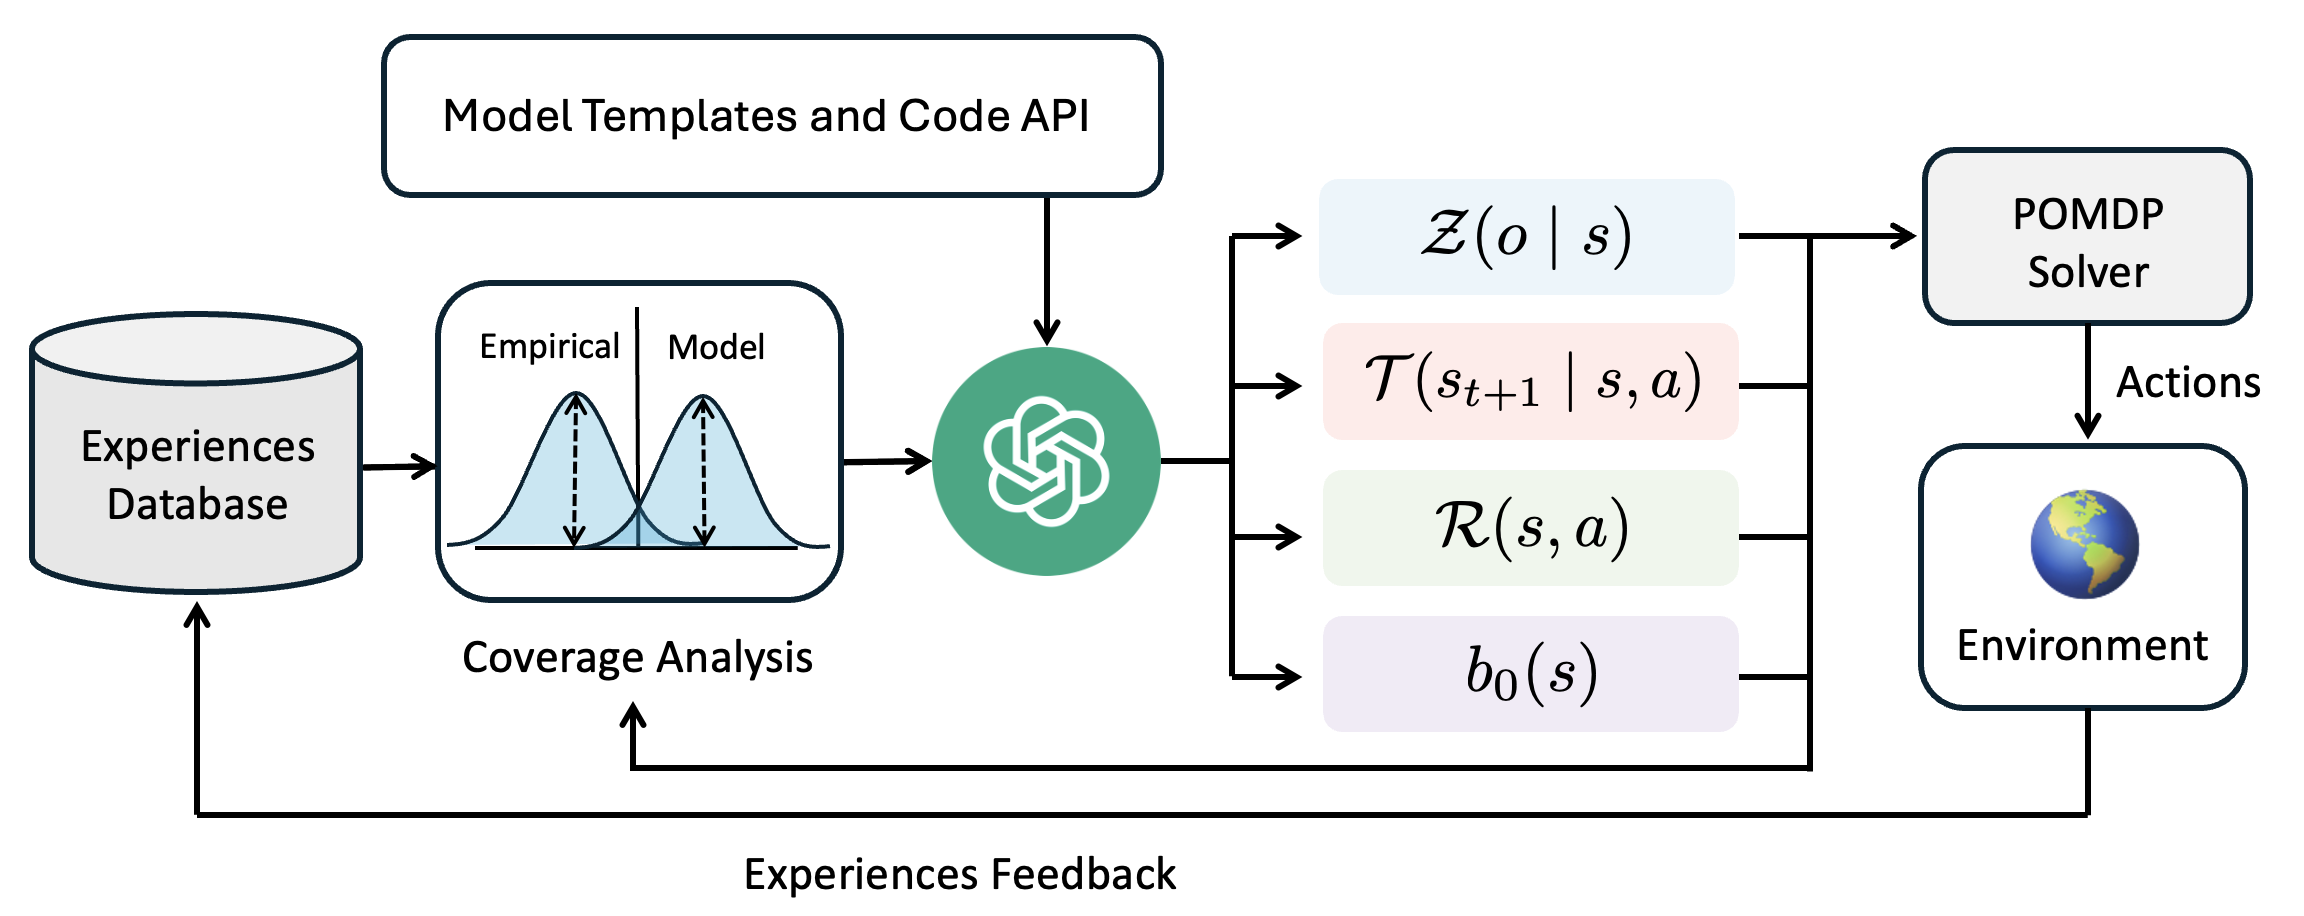
The image is a technical flowchart diagram illustrating a closed-loop system for decision-making or reinforcement learning. It depicts how an "Experiences Database" feeds into a "Coverage Analysis" module, which is then processed by a central AI component (represented by a green circular icon) to generate the parameters of a Partially Observable Markov Decision Process (POMDP). These parameters are used by a "POMDP Solver" to select actions for an "Environment," with the resulting experiences looping back to the database. The diagram emphasizes a cycle of experience collection, model analysis, planning, and execution.
### Components/Axes
The diagram is organized into several interconnected blocks and flows. There are no traditional chart axes. The key components, their labels, and spatial relationships are:
1. **Top Input Block (Top-Center):**
* **Label:** `Model Templates and Code API`
* **Description:** A rectangular box with a dark border. An arrow points downward from this block to the central AI icon.
2. **Experience Source (Left):**
* **Label:** `Experiences Database`
* **Description:** A cylinder icon representing a database. An arrow points rightward to the "Coverage Analysis" block. A feedback arrow from the bottom of the diagram points upward into this database.
3. **Analysis Module (Center-Left):**
* **Label:** `Coverage Analysis`
* **Description:** A rectangular block containing a plot. The plot shows two overlapping bell curves (distributions). The left curve is labeled `Empirical` and the right curve is labeled `Model`. Dashed vertical lines indicate the peaks of each distribution. An arrow points rightward from this block to the central AI icon.
4. **Central Processing Unit (Center):**
* **Description:** A green circular icon containing a white, intricate knot or brain-like symbol. This is the central processing node. It receives inputs from "Model Templates and Code API" and "Coverage Analysis." It outputs four arrows to the right.
5. **POMDP Parameter Blocks (Center-Right):**
* These are four colored, rounded rectangles stacked vertically, each containing a mathematical function. They are the outputs of the central AI.
* **Top (Light Blue):** `Z(o | s)` - Observation model.
* **Second (Light Pink):** `T(s_{t+1} | s, a)` - Transition model.
* **Third (Light Green):** `R(s, a)` - Reward function.
* **Bottom (Light Purple):** `b_0(s)` - Initial belief state.
* **Spatial Grounding:** All four blocks are aligned vertically to the right of the central AI icon. Arrows from each point rightward to the "POMDP Solver."
6. **Solver (Right):**
* **Label:** `POMDP Solver`
* **Description:** A rectangular box. It receives inputs from the four POMDP parameter blocks. An arrow labeled `Actions` points downward from this block to the "Environment."
7. **Environment (Bottom-Right):**
* **Label:** `Environment`
* **Description:** A rectangular box containing a globe icon (Earth). It receives `Actions` from the solver. An arrow labeled `Experiences Feedback` originates from this block and travels leftward along the bottom of the diagram, then upward to the "Experiences Database."
8. **Feedback Loop (Bottom):**
* **Label:** `Experiences Feedback`
* **Description:** A long arrow running along the bottom edge of the diagram, connecting the "Environment" back to the "Experiences Database." A secondary branch of this feedback arrow points upward to the "Coverage Analysis" block.
### Detailed Analysis
The diagram details a specific workflow:
1. **Data Flow:** The process begins with historical data in the `Experiences Database`. This data is analyzed in the `Coverage Analysis` module, which visually compares the distribution of empirical data against a model's predictions (the two bell curves).
2. **Model Generation:** The central AI (green icon) uses the results of the coverage analysis, along with predefined `Model Templates and Code API`, to construct or refine a POMDP model. It outputs the four core components of a POMDP:
* `Z(o | s)`: The probability of making observation `o` given state `s`.
* `T(s_{t+1} | s, a)`: The probability of transitioning to state `s_{t+1}` from state `s` after taking action `a`.
* `R(s, a)`: The immediate reward received for taking action `a` in state `s`.
* `b_0(s)`: The initial probability distribution over states (belief state).
3. **Planning and Execution:** The `POMDP Solver` uses these four parameters to compute optimal `Actions`. These actions are executed in the `Environment`.
4. **Learning Loop:** The outcomes of these actions in the environment generate new experiences. This `Experiences Feedback` is sent back to update the `Experiences Database` and is also used directly by the `Coverage Analysis` module, creating a closed loop for continuous learning and model improvement.
### Key Observations
* The system is explicitly designed for **Partially Observable** environments, as indicated by the POMDP framework and the inclusion of an observation model `Z(o | s)` and a belief state `b_0(s)`.
* The `Coverage Analysis` component is critical. Its visual depiction suggests the system's goal is to align the model's predictions with real-world empirical data, likely to identify and correct model inaccuracies or areas where the model is uncertain.
* The feedback loop is dual-purpose: it populates the database for future analysis and provides immediate feedback to the coverage analysis, enabling rapid model adjustment.
* The central AI icon acts as a **model constructor or refiner**, not just a solver. It translates analysis and templates into a formal mathematical model.
### Interpretation
This diagram represents a sophisticated, adaptive model-based reinforcement learning system. The core innovation appears to be the integration of a dedicated **coverage analysis** step that explicitly compares model and data distributions. This suggests the system is designed to be **self-aware of its model's limitations**.
The workflow implies a Peircean investigative cycle:
1. **Abduction:** The `Coverage Analysis` identifies a discrepancy (the gap between the `Empirical` and `Model` curves), posing a question about the model's accuracy.
2. **Deduction:** The central AI, using templates, hypothesizes a new or updated POMDP model (`Z, T, R, b_0`) that might better explain the data.
3. **Induction:** The `POMDP Solver` tests this hypothesis by generating actions in the `Environment`. The resulting `Experiences Feedback` provides new data to validate or refute the model's predictions in the next cycle.
The system matters because it moves beyond simply using a fixed model for planning. It creates a framework for **continuous model discovery and validation** grounded in experience. This is crucial for deploying AI in complex, real-world environments where the initial model is likely to be incomplete or incorrect. The "Model Templates and Code API" input suggests this process can be guided by human knowledge or prior architectures, making it a hybrid of data-driven and knowledge-driven learning.
DECODING INTELLIGENCE...