\n
## Diagram: Stroke Diagnosis Procedure
### Overview
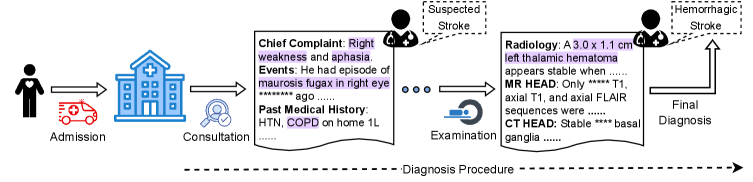
This diagram illustrates the diagnostic procedure for a stroke patient, starting from admission and culminating in a final diagnosis. It depicts a sequential flow of events, including patient presentation, consultation, examination, and radiological findings, leading to a diagnosis of hemorrhagic stroke. The diagram uses icons and text boxes to represent each stage.
### Components/Axes
The diagram is structured as a horizontal flow chart with the following components:
* **Patient Icon:** Represents the patient at the beginning of the process.
* **Hospital Icon:** Represents the hospital/admission stage.
* **Consultation Icon:** Represents the consultation stage with a stethoscope and clipboard.
* **Examination Icon:** Represents the examination stage with a gurney and medical equipment.
* **Neurologist Icons:** Two head silhouettes representing neurological assessment at "Suspected Stroke" and "Hemorrhagic Stroke" stages.
* **Text Boxes:** Contain detailed information about the patient's condition, medical history, and radiological findings.
* **Arrows:** Indicate the flow of the diagnostic process.
* **"Diagnosis Procedure" Label:** Located at the bottom, indicating the overall process being depicted.
### Detailed Analysis or Content Details
The diagram details the following information at each stage:
1. **Admission:** Patient enters the process.
2. **Consultation:**
* **Chief Complaint:** Right weakness and aphasia.
* **Events:** Episode of amaurosis fugax in right eye ago. (The exact time frame is obscured by "......")
* **Past Medical History:** HTN, COPD on home 1L. (Likely referring to 1 liter of oxygen)
3. **Examination:**
* **MR HEAD:** Only T1, axial T1, and axial FLAIR sequences were performed.
* **CT HEAD:** Stable basal ganglia.
4. **Suspected Stroke:** Neurologist assessment.
5. **Radiology:**
* A 3.0 x 1.1 cm left thalamic hematoma appears stable when. (The rest of the sentence is obscured by "......")
6. **Hemorrhagic Stroke:** Final diagnosis confirmed by a neurologist.
The arrows indicate a sequential flow: Admission -> Consultation -> Examination -> Suspected Stroke -> Radiology -> Hemorrhagic Stroke (Final Diagnosis). There are dashed arrows indicating a feedback loop from Radiology back to the Neurologist for final diagnosis.
### Key Observations
* The diagram highlights the importance of rapid diagnosis in stroke cases.
* The inclusion of past medical history and specific symptoms (amaurosis fugax) suggests a focus on identifying the cause of the stroke.
* The radiological findings (thalamic hematoma) are crucial for confirming the diagnosis.
* The use of "......" indicates missing or redacted information.
### Interpretation
The diagram illustrates a typical diagnostic pathway for a patient presenting with stroke symptoms. The process begins with initial assessment and gathering of patient history, followed by neurological examination and imaging studies (MR and CT scans). The radiological findings, specifically the presence of a left thalamic hematoma, lead to a final diagnosis of hemorrhagic stroke. The diagram emphasizes the importance of a systematic approach to stroke diagnosis, combining clinical evaluation with imaging evidence. The redacted information suggests that the diagram may be a simplified representation of a more complex process, or that specific details are confidential. The flow suggests a relatively linear process, but the dashed arrows indicate that the radiologist's findings can trigger further neurological assessment. The diagram is a visual aid for understanding the steps involved in stroke diagnosis and the information required to reach a definitive conclusion.