## Line Chart: Cost Comparison of Memory Architectures vs. Usage Frequency
### Overview
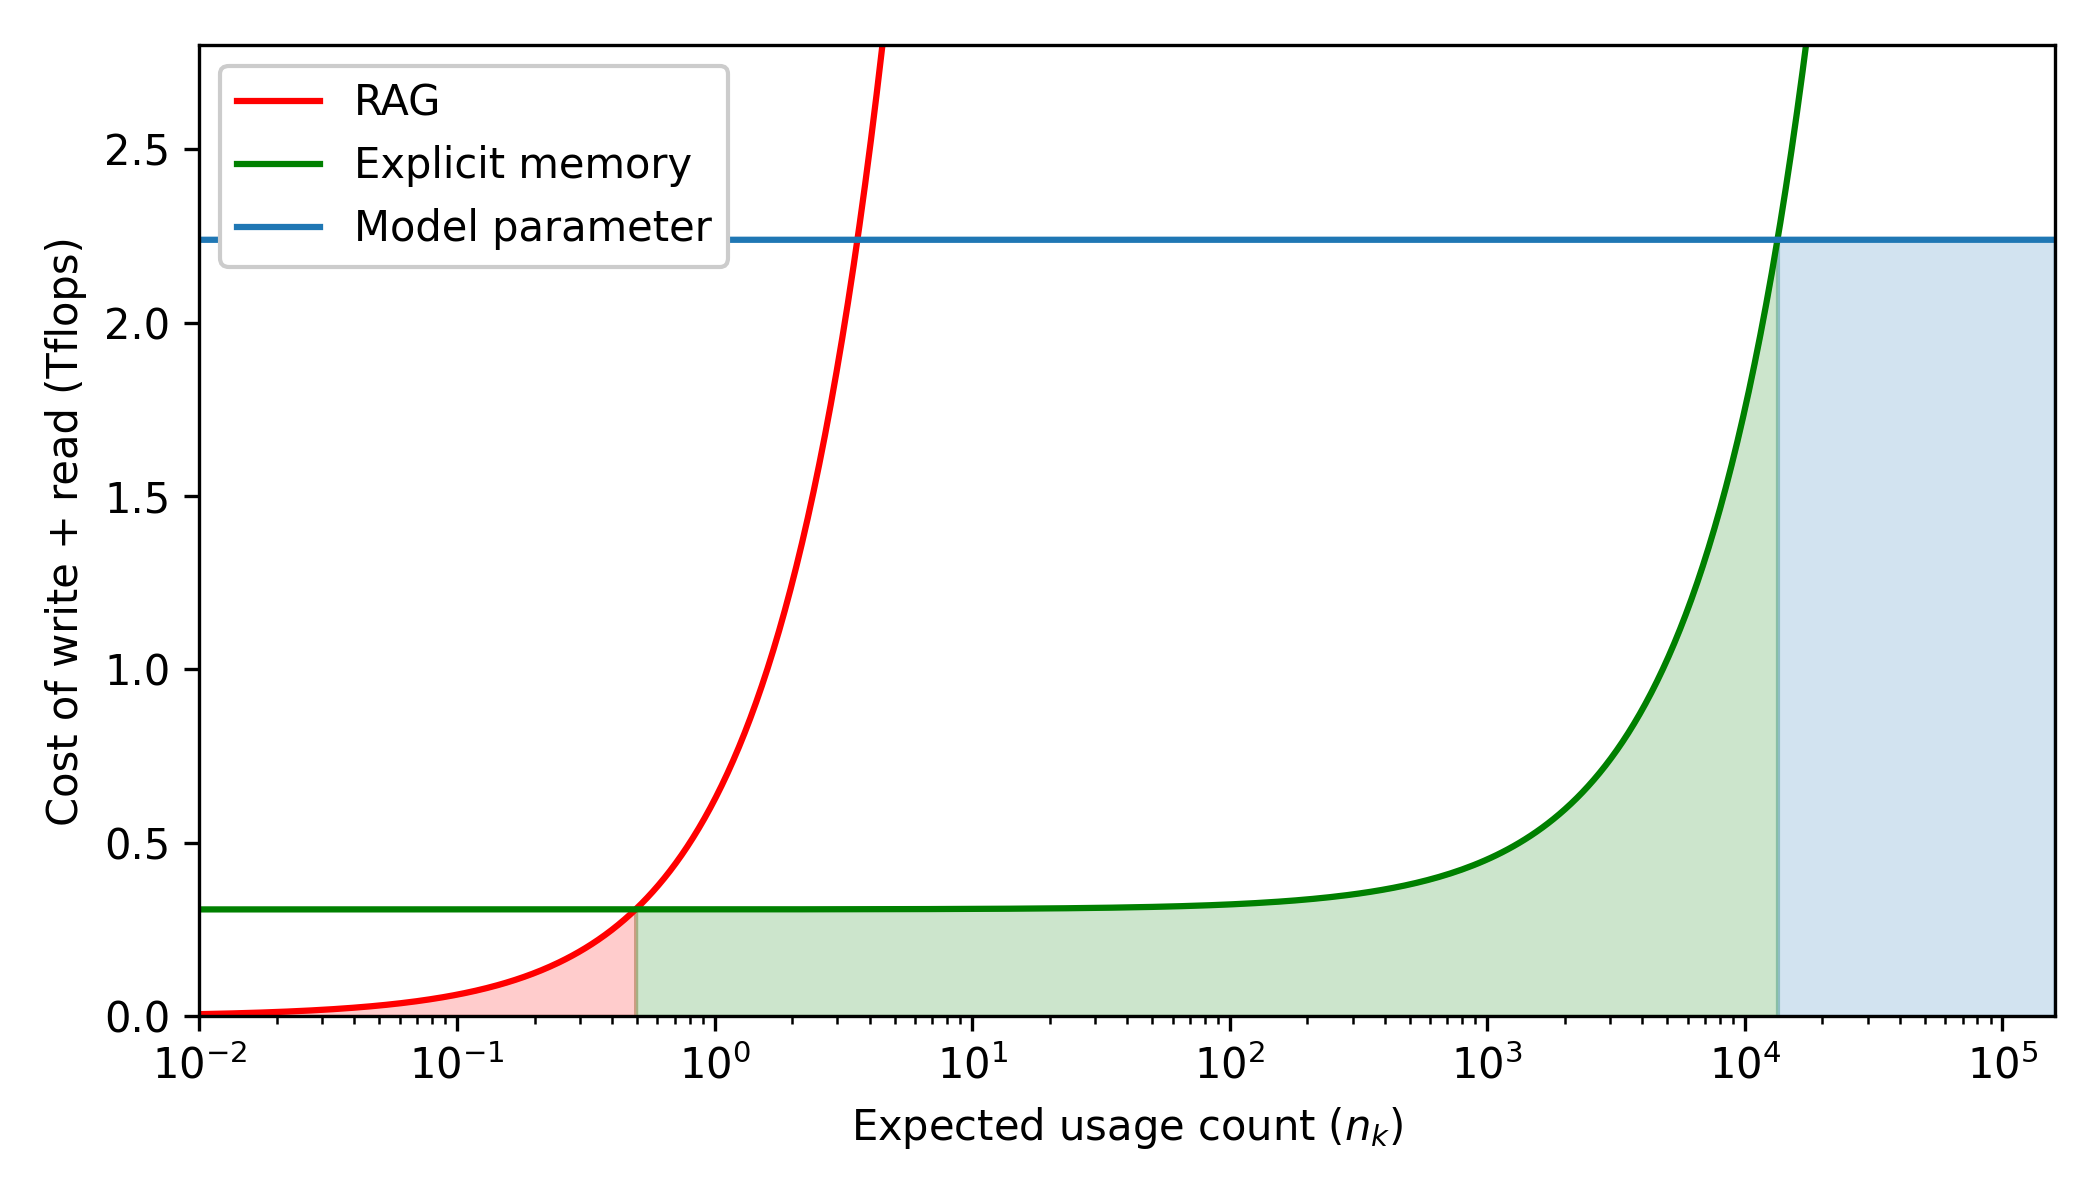
This is a technical line chart comparing the computational cost (in Tflops) of three different memory or knowledge retrieval approaches as a function of their expected usage frequency. The chart uses a semi-logarithmic scale (logarithmic x-axis, linear y-axis) to visualize performance across several orders of magnitude of usage.
### Components/Axes
* **Chart Type:** Semi-log line chart with shaded regions under each curve.
* **X-Axis:**
* **Label:** `Expected usage count (n_k)`
* **Scale:** Logarithmic (base 10).
* **Range & Ticks:** Spans from `10^-2` (0.01) to `10^5` (100,000). Major ticks are at each power of 10: `10^-2`, `10^-1`, `10^0`, `10^1`, `10^2`, `10^3`, `10^4`, `10^5`.
* **Y-Axis:**
* **Label:** `Cost of write + read (Tflops)`
* **Scale:** Linear.
* **Range & Ticks:** Spans from `0.0` to approximately `2.7`. Major ticks are at intervals of `0.5`: `0.0`, `0.5`, `1.0`, `1.5`, `2.0`, `2.5`.
* **Legend:** Located in the top-left corner of the plot area.
* **Red Line:** `RAG`
* **Green Line:** `Explicit memory`
* **Blue Line:** `Model parameter`
* **Shaded Regions:** Each line has a semi-transparent shaded area beneath it, colored to match its line (red, green, blue).
### Detailed Analysis
**1. Data Series Trends & Approximate Values:**
* **RAG (Red Line):**
* **Trend:** Starts at near-zero cost for very low usage (`n_k < 10^-1`). The cost increases exponentially (appears as a steep, near-vertical line on this semi-log plot) as usage approaches and surpasses `n_k = 10^0` (1). The line exits the top of the chart (cost > 2.7 Tflops) shortly after `n_k = 10^0`.
* **Key Point:** The cost becomes prohibitively high very quickly with increased usage. It intersects the `Explicit memory` line at approximately `n_k = 0.5` (midway between `10^-1` and `10^0` on the log scale) at a cost of ~0.3 Tflops.
* **Explicit Memory (Green Line):**
* **Trend:** Maintains a constant, low baseline cost (~0.3 Tflops) across a wide range of low-to-moderate usage frequencies, from `n_k = 10^-2` up to approximately `n_k = 10^2` (100). After this point, the cost begins to rise, increasing sharply (exponentially) as usage approaches `n_k = 10^4` (10,000). The line exits the top of the chart (cost > 2.7 Tflops) just after `n_k = 10^4`.
* **Key Point:** This method is cost-effective for a broad middle range of usage frequencies. It intersects the `Model parameter` line at approximately `n_k = 1.5 x 10^4` (15,000) at a cost of ~2.25 Tflops.
* **Model Parameter (Blue Line):**
* **Trend:** A perfectly horizontal line, indicating a fixed cost independent of the usage count `n_k`.
* **Value:** The constant cost is approximately **2.25 Tflops** (visually estimated as halfway between the 2.0 and 2.5 tick marks).
**2. Spatial Grounding of Shaded Regions:**
* The **red shaded region** (RAG) is a small, triangular area in the bottom-left, bounded by the red line, the x-axis, and the vertical line at its intersection with the green line (~`n_k=0.5`).
* The **green shaded region** (Explicit memory) is the largest area, spanning from the y-axis to the vertical line at its intersection with the blue line (~`n_k=1.5x10^4`). It is bounded above by the green curve.
* The **blue shaded region** (Model parameter) is a rectangular area on the far right, from the vertical line at ~`n_k=1.5x10^4` to the right edge of the chart (`n_k=10^5`), bounded above by the horizontal blue line.
### Key Observations
1. **Cost Regimes:** The chart defines three distinct cost regimes based on usage frequency (`n_k`):
* **Low Usage (`n_k < ~0.5`):** RAG is the cheapest option.
* **Moderate Usage (`0.5 < n_k < ~15,000`):** Explicit Memory is the cheapest option.
* **High Usage (`n_k > ~15,000`):** Model Parameter (fixed cost) becomes the cheapest option.
2. **Scaling Behavior:** RAG scales extremely poorly with usage. Explicit Memory scales well until a very high usage threshold. Model Parameter cost does not scale with usage at all.
3. **Intersection Points:** The two critical crossover points (RAG/Explicit Memory at ~0.5, Explicit Memory/Model Parameter at ~15,000) define the boundaries of the optimal usage ranges for each method.
### Interpretation
This chart illustrates a fundamental trade-off in system design between **initial setup cost** and **marginal operational cost**.
* **RAG (Retrieval-Augmented Generation)** has near-zero setup cost but a very high marginal cost per usage, making it suitable only for information accessed very infrequently.
* **Explicit Memory** represents a system with a moderate, fixed setup cost (the flat ~0.3 Tflops) and a low marginal cost up to a point. Once the volume of data or accesses exceeds a certain threshold (`n_k ~100-1000`), managing this explicit memory becomes increasingly expensive, likely due to search, indexing, or bandwidth constraints.
* **Model Parameter** (e.g., baking knowledge directly into a neural network's weights) has a very high, fixed setup cost (training: ~2.25 Tflops) but zero marginal cost for retrieval. This makes it the most economical choice for knowledge that is accessed extremely frequently, as the high initial investment is amortized over countless uses.
The chart argues that the "best" architecture is not universal but is dictated by the expected access pattern (`n_k`). It provides a quantitative framework for deciding when to use a database-like retrieval system (RAG), a dedicated memory module, or to invest in training the knowledge directly into a model. The shaded regions visually emphasize the total cost of ownership for each approach within its optimal domain.