## Chart Type: Line Graphs Comparing "I-Don't-Know" Rates
### Overview
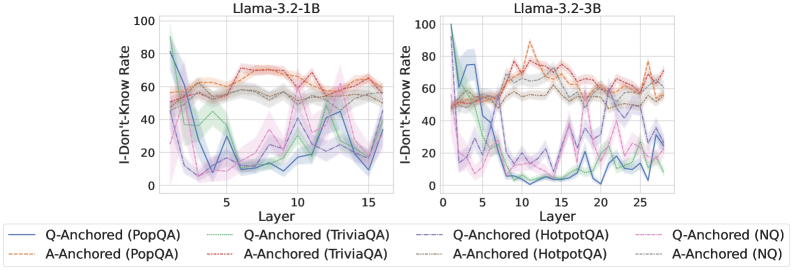
The image presents two line graphs side-by-side, comparing the "I-Don't-Know" rates of different question-answering models across various layers. The left graph represents "Llama-3.2-1B," while the right graph represents "Llama-3.2-3B." Each graph plots the "I-Don't-Know" rate (percentage) on the y-axis against the layer number on the x-axis. Different colored lines represent different question-answering strategies, anchored either by question (Q-Anchored) or answer (A-Anchored), and tested on different datasets (PopQA, TriviaQA, HotpotQA, and NQ). The shaded areas around each line indicate the uncertainty or variance in the data.
### Components/Axes
* **Titles:**
* Left Graph: "Llama-3.2-1B"
* Right Graph: "Llama-3.2-3B"
* **Y-Axis:**
* Label: "I-Don't-Know Rate"
* Scale: 0 to 100, with tick marks at 0, 20, 40, 60, 80, and 100.
* **X-Axis:**
* Label: "Layer"
* Left Graph Scale: 0 to 15, with tick marks at intervals of 5.
* Right Graph Scale: 0 to 25, with tick marks at intervals of 5.
* **Legend:** Located at the bottom of the image.
* Q-Anchored (PopQA): Solid Blue Line
* A-Anchored (PopQA): Dashed Brown Line
* Q-Anchored (TriviaQA): Dotted Green Line
* A-Anchored (TriviaQA): Dotted-Dashed Gray Line
* Q-Anchored (HotpotQA): Dashed Purple Line
* A-Anchored (HotpotQA): Solid Green Line
* Q-Anchored (NQ): Dotted-Dashed Red Line
* A-Anchored (NQ): Dotted Gray Line
### Detailed Analysis
**Left Graph (Llama-3.2-1B):**
* **Q-Anchored (PopQA):** (Solid Blue Line) Starts high (around 80%), drops sharply to below 20% by layer 5, then fluctuates between 10% and 30% for the remaining layers.
* **A-Anchored (PopQA):** (Dashed Brown Line) Starts around 60%, fluctuates between 55% and 70% across all layers.
* **Q-Anchored (TriviaQA):** (Dotted Green Line) Starts around 60%, decreases to approximately 20% by layer 5, then fluctuates between 20% and 50% for the remaining layers.
* **A-Anchored (TriviaQA):** (Dotted-Dashed Gray Line) Starts around 60%, remains relatively stable between 55% and 65% across all layers.
* **Q-Anchored (HotpotQA):** (Dashed Purple Line) Starts around 50%, drops to approximately 10% by layer 5, then fluctuates between 10% and 30% for the remaining layers.
* **A-Anchored (HotpotQA):** (Solid Green Line) Starts around 40%, decreases to approximately 15% by layer 5, then fluctuates between 15% and 45% for the remaining layers.
* **Q-Anchored (NQ):** (Dotted-Dashed Red Line) Starts around 60%, remains relatively stable between 60% and 70% across all layers.
* **A-Anchored (NQ):** (Dotted Gray Line) Starts around 50%, remains relatively stable between 50% and 60% across all layers.
**Right Graph (Llama-3.2-3B):**
* **Q-Anchored (PopQA):** (Solid Blue Line) Starts high (around 90%), drops sharply to below 10% by layer 5, then fluctuates between 0% and 20% for the remaining layers.
* **A-Anchored (PopQA):** (Dashed Brown Line) Starts around 50%, increases and fluctuates between 60% and 90% across all layers.
* **Q-Anchored (TriviaQA):** (Dotted Green Line) Starts around 90%, decreases to approximately 10% by layer 5, then fluctuates between 10% and 40% for the remaining layers.
* **A-Anchored (TriviaQA):** (Dotted-Dashed Gray Line) Starts around 50%, remains relatively stable between 50% and 70% across all layers.
* **Q-Anchored (HotpotQA):** (Dashed Purple Line) Starts around 50%, drops to approximately 5% by layer 5, then fluctuates between 5% and 30% for the remaining layers.
* **A-Anchored (HotpotQA):** (Solid Green Line) Starts around 70%, decreases to approximately 10% by layer 5, then fluctuates between 10% and 40% for the remaining layers.
* **Q-Anchored (NQ):** (Dotted-Dashed Red Line) Starts around 50%, increases and fluctuates between 60% and 80% across all layers.
* **A-Anchored (NQ):** (Dotted Gray Line) Starts around 60%, remains relatively stable between 50% and 70% across all layers.
### Key Observations
* For both Llama models, the "Q-Anchored (PopQA)" line shows a significant drop in the "I-Don't-Know" rate within the first few layers.
* The "A-Anchored (PopQA)" line generally shows a higher and more stable "I-Don't-Know" rate compared to the "Q-Anchored (PopQA)" line.
* The "I-Don't-Know" rates for "Q-Anchored (HotpotQA)" and "A-Anchored (HotpotQA)" also decrease significantly within the first few layers.
* The "I-Don't-Know" rates for "A-Anchored (TriviaQA)" and "A-Anchored (NQ)" are relatively stable across all layers.
* The "I-Don't-Know" rates for "Q-Anchored (TriviaQA)" decreases significantly within the first few layers.
* The "I-Don't-Know" rates for "Q-Anchored (NQ)" increases and fluctuates across all layers.
* The shaded areas around the lines indicate the variance in the data, with some lines showing more fluctuation than others.
### Interpretation
The graphs compare the "I-Don't-Know" rates of different question-answering models (Llama-3.2-1B and Llama-3.2-3B) across various layers. The different colored lines represent different question-answering strategies, anchored either by question (Q-Anchored) or answer (A-Anchored), and tested on different datasets (PopQA, TriviaQA, HotpotQA, and NQ).
The data suggests that the "Q-Anchored" strategies, particularly with the PopQA dataset, initially have a high "I-Don't-Know" rate, but this rate decreases significantly within the first few layers. This could indicate that the model learns to answer these questions more effectively as it processes more layers. In contrast, the "A-Anchored" strategies generally show a more stable "I-Don't-Know" rate across all layers, suggesting that the model's ability to answer questions based on the answer alone does not change significantly as it processes more layers.
The differences between the two Llama models (1B and 3B) are subtle, but it appears that the 3B model generally has lower "I-Don't-Know" rates for the "Q-Anchored" strategies, suggesting that it is better at answering questions based on the question alone.
The shaded areas around the lines indicate the variance in the data, with some lines showing more fluctuation than others. This could be due to the nature of the dataset or the specific question-answering strategy used.