## Line Chart: MSE vs. Pilot Size for Different Algorithms
### Overview
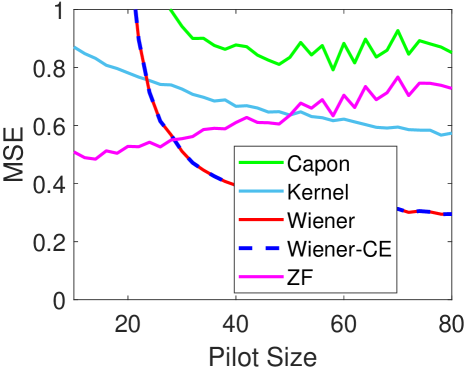
The image is a line chart comparing the Mean Squared Error (MSE) of five different algorithms (Capon, Kernel, Wiener, Wiener-CE, and ZF) as a function of pilot size. The x-axis represents the pilot size, ranging from approximately 0 to 80. The y-axis represents the MSE, ranging from 0 to 1.
### Components/Axes
* **X-axis:** Pilot Size, ranging from 0 to 80, with tick marks at 20, 40, 60, and 80.
* **Y-axis:** MSE (Mean Squared Error), ranging from 0 to 1, with tick marks at 0.2, 0.4, 0.6, 0.8, and 1.
* **Legend (located on the right side of the chart):**
* Green: Capon
* Light Blue: Kernel
* Red: Wiener
* Dashed Dark Blue: Wiener-CE
* Magenta: ZF
### Detailed Analysis
* **Capon (Green):** The MSE starts around 0.95 at a pilot size of 10 and decreases slightly to approximately 0.85 at a pilot size of 80. The line is relatively flat with some minor fluctuations.
* **Kernel (Light Blue):** The MSE starts around 0.85 at a pilot size of 10 and decreases to approximately 0.58 at a pilot size of 80. The line shows a gradual downward trend.
* **Wiener (Red):** The MSE starts at 1.0 at a pilot size of 10 and decreases rapidly to approximately 0.3 at a pilot size of 40. It then remains relatively constant around 0.3 until a pilot size of 80.
* **Wiener-CE (Dashed Dark Blue):** The MSE follows a similar trend to the Wiener algorithm. It starts at 1.0 at a pilot size of 10 and decreases rapidly to approximately 0.3 at a pilot size of 40. It then remains relatively constant around 0.3 until a pilot size of 80. The Wiener and Wiener-CE lines overlap significantly after a pilot size of 40.
* **ZF (Magenta):** The MSE starts around 0.5 at a pilot size of 10 and increases to approximately 0.65 at a pilot size of 80. The line shows a gradual upward trend with some fluctuations.
### Key Observations
* The Wiener and Wiener-CE algorithms have the lowest MSE for pilot sizes greater than 40.
* The Capon algorithm has the highest MSE across all pilot sizes.
* The Kernel algorithm shows a consistent decrease in MSE as the pilot size increases.
* The ZF algorithm shows a consistent increase in MSE as the pilot size increases.
* The Wiener and Wiener-CE algorithms converge to similar MSE values as the pilot size increases.
### Interpretation
The chart demonstrates the performance of different algorithms in terms of MSE as a function of pilot size. The Wiener and Wiener-CE algorithms perform best for larger pilot sizes, suggesting they are more robust to noise or interference. The Capon algorithm consistently performs the worst. The Kernel and ZF algorithms show opposite trends, with the Kernel algorithm improving with larger pilot sizes and the ZF algorithm worsening. The convergence of the Wiener and Wiener-CE algorithms suggests that channel estimation becomes less critical as the pilot size increases. The rapid decrease in MSE for the Wiener and Wiener-CE algorithms at smaller pilot sizes indicates that these algorithms benefit significantly from even a small amount of pilot data.