# Technical Data Extraction: MSE vs. Pilot Size Performance Chart
## 1. Component Isolation
* **Header:** None present.
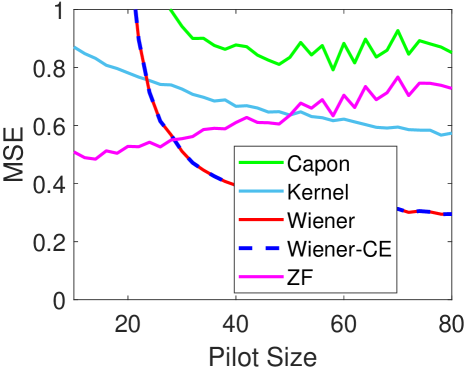
* **Main Chart Area:** A 2D line graph plotting Mean Squared Error (MSE) against Pilot Size. It contains five distinct data series.
* **Legend:** Located in the lower-right quadrant of the plot area (approximate spatial grounding: [x=0.5 to 0.9, y=0.1 to 0.5]). It is enclosed in a black rectangular border with a white background.
* **Axes:**
* **Y-Axis (Vertical):** Labeled "MSE". Scale ranges from 0 to 1 with major tick marks at intervals of 0.2.
* **X-Axis (Horizontal):** Labeled "Pilot Size". Scale ranges from approximately 10 to 80 with major tick marks labeled at 20, 40, 60, and 80.
---
## 2. Legend and Series Identification
| Series Label | Line Color | Line Style | Visual Trend Description |
| :--- | :--- | :--- | :--- |
| **Capon** | Green | Solid | Starts high (>1.0), drops quickly, then fluctuates with a slight downward trend, remaining the highest MSE overall. |
| **Kernel** | Light Blue | Solid | Steady, linear-like downward slope across the entire x-axis range. |
| **Wiener** | Red | Solid | Sharp exponential-like decay. Note: This line is overlaid by the Wiener-CE dashed line. |
| **Wiener-CE** | Dark Blue | Dashed | Identical path to "Wiener". Sharp decay, flattening out as Pilot Size increases. |
| **ZF** | Magenta | Solid | Steady upward slope; performance degrades (MSE increases) as Pilot Size increases. |
---
## 3. Data Extraction and Trend Analysis
### Series 1: Capon (Green Solid Line)
* **Trend:** High initial error with significant variance/noise.
* **Key Points:**
* At Pilot Size ~30: MSE $\approx$ 1.0
* At Pilot Size ~50: MSE $\approx$ 0.82
* At Pilot Size ~80: MSE $\approx$ 0.85 (with peaks reaching ~0.95 near Pilot Size 70).
### Series 2: Kernel (Light Blue Solid Line)
* **Trend:** Consistent improvement.
* **Key Points:**
* At Pilot Size 10: MSE $\approx$ 0.88
* At Pilot Size 40: MSE $\approx$ 0.68
* At Pilot Size 80: MSE $\approx$ 0.58
### Series 3 & 4: Wiener & Wiener-CE (Red Solid / Blue Dashed)
* **Trend:** These two series are perfectly correlated in this visualization. They show the most rapid improvement, starting off-chart (MSE > 1) and becoming the best-performing methods (lowest MSE) after a Pilot Size of approximately 30.
* **Key Points:**
* At Pilot Size 20: MSE $\approx$ 1.0
* At Pilot Size 30: MSE $\approx$ 0.55 (Crosses the ZF line here)
* At Pilot Size 40: MSE $\approx$ 0.40
* At Pilot Size 80: MSE $\approx$ 0.30
### Series 5: ZF (Magenta Solid Line)
* **Trend:** Counter-intuitive upward trend; as Pilot Size increases, the Mean Squared Error increases.
* **Key Points:**
* At Pilot Size 10: MSE $\approx$ 0.50
* At Pilot Size 40: MSE $\approx$ 0.60
* At Pilot Size 80: MSE $\approx$ 0.75
---
## 4. Summary of Findings
* **Optimal Method:** The **Wiener** and **Wiener-CE** methods provide the lowest MSE for Pilot Sizes greater than 30.
* **Crossover Point:** At a Pilot Size of approximately 28-30, the Wiener methods overtake the ZF method in accuracy.
* **Performance Degradation:** The **ZF** (Zero Forcing) method is the only one that shows a positive correlation between Pilot Size and MSE, indicating it performs worse with more data in this specific simulation.
* **Stability:** The **Kernel** method shows the most stable and predictable rate of improvement, while the **Capon** method exhibits the highest level of volatility.