\n
## Chart: Receiver Operating Characteristic (ROC) Curves
### Overview
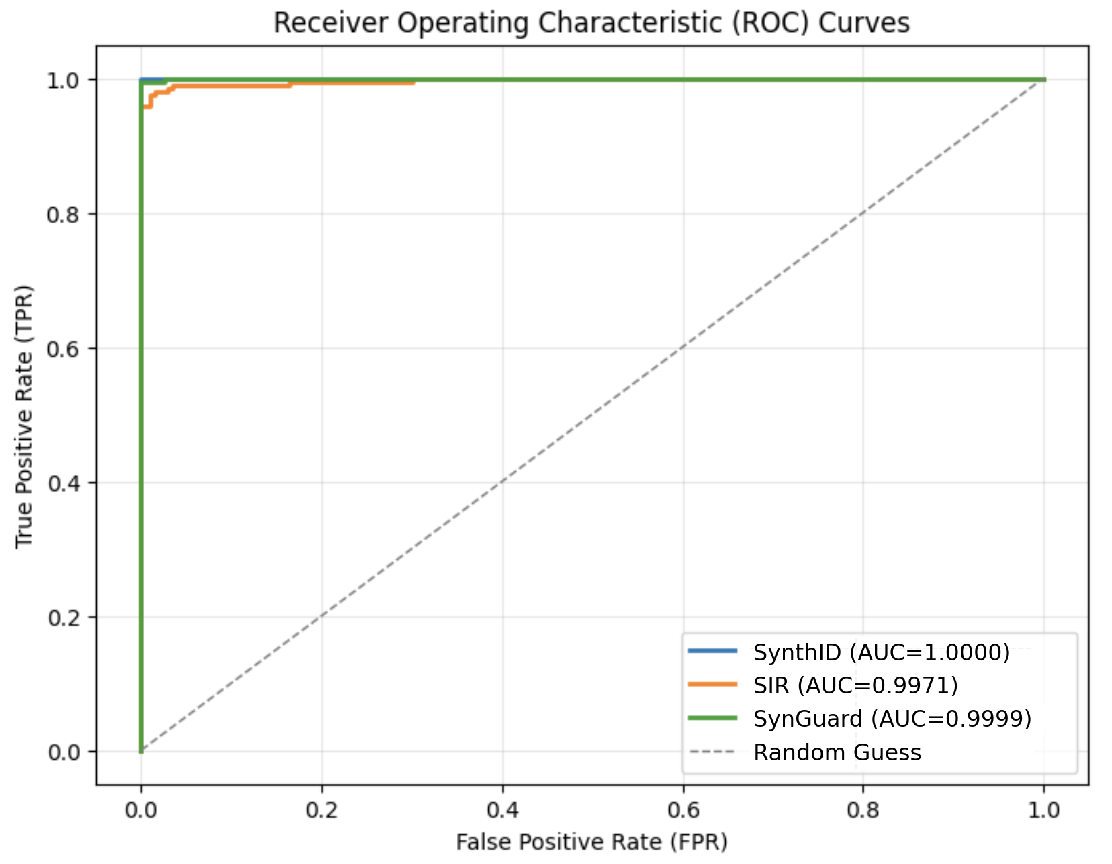
The image displays Receiver Operating Characteristic (ROC) curves for three different models: SynthID, SIR, and SynGuard, along with a diagonal line representing a random guess. The chart assesses the performance of these models in distinguishing between two classes (positive and negative) as their discrimination threshold is varied.
### Components/Axes
* **Title:** Receiver Operating Characteristic (ROC) Curves
* **X-axis:** False Positive Rate (FPR) - Scale ranges from 0.0 to 1.0.
* **Y-axis:** True Positive Rate (TPR) - Scale ranges from 0.0 to 1.0.
* **Legend:** Located in the bottom-right corner.
* SynthID (Blue) - AUC = 1.0000
* SIR (Orange) - AUC = 0.9971
* SynGuard (Green) - AUC = 0.9999
* Random Guess (Gray dashed line)
* **Gridlines:** Present to aid in reading values.
### Detailed Analysis
The chart shows three curves representing the performance of the three models.
* **SynthID (Blue):** The curve starts at approximately (0.0, 1.0) and remains close to TPR = 1.0 across the entire FPR range. This indicates excellent performance. The Area Under the Curve (AUC) is reported as 1.0000.
* **SIR (Orange):** The curve starts at approximately (0.0, 1.0) and descends gradually as FPR increases. It remains above the random guess line. The AUC is reported as 0.9971.
* **SynGuard (Green):** The curve starts at approximately (0.0, 1.0) and descends gradually as FPR increases. It remains above the random guess line. The AUC is reported as 0.9999.
* **Random Guess (Gray dashed line):** This is a diagonal line from (0.0, 0.0) to (1.0, 1.0). It represents the performance of a classifier that randomly guesses the class label.
### Key Observations
* All three models (SynthID, SIR, and SynGuard) significantly outperform the random guess line.
* SynthID has the highest AUC (1.0000), indicating perfect discrimination.
* SynGuard has a very high AUC (0.9999), nearly as good as SynthID.
* SIR has a slightly lower AUC (0.9971) but still demonstrates excellent performance.
* The curves for all three models are very close to the top-left corner of the chart, indicating high TPR and low FPR.
### Interpretation
The ROC curves demonstrate that all three models are highly effective at distinguishing between the two classes. SynthID appears to be the best performing model, achieving perfect discrimination (AUC = 1.0). SynGuard is a very close second, and SIR also exhibits excellent performance. The high AUC values for all models suggest they are reliable and can be used with confidence. The fact that all curves are well above the random guess line confirms that the models are significantly better than chance at making predictions. The curves' proximity to the top-left corner indicates that the models can achieve high true positive rates with low false positive rates. This is desirable in many applications where minimizing false positives is crucial.