## Charts: Loss vs Model and Dataset Size
### Overview
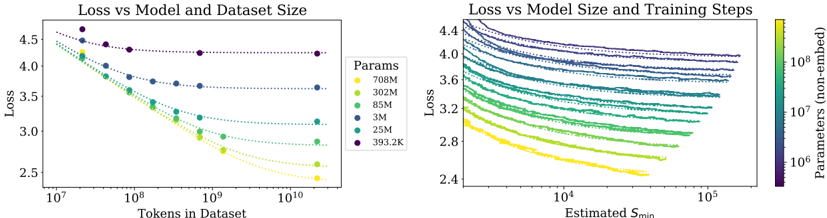
The image presents two charts visualizing the relationship between loss and model/dataset size. The left chart shows Loss vs. Tokens in Dataset, while the right chart shows Loss vs. Estimated S_min (likely a measure of training steps). Both charts use color to represent the number of parameters in the model.
### Components/Axes
**Left Chart:**
* **Title:** Loss vs Model and Dataset Size
* **X-axis:** Tokens in Dataset (log scale, ranging from approximately 10^7 to 10^10)
* **Y-axis:** Loss (ranging from approximately 2.5 to 4.5)
* **Legend:** Params (color-coded)
* 708M (Yellow)
* 302M (Green)
* 85M (Light Blue)
* 3M (Dark Blue)
* 25M (Orange)
* 393.2K (Purple)
**Right Chart:**
* **Title:** Loss vs Model Size and Training Steps
* **X-axis:** Estimated S_min (log scale, ranging from approximately 10^4 to 10^5)
* **Y-axis:** Loss (ranging from approximately 2.4 to 4.4)
* **Colorbar:** Parameters (non-embedded) (log scale, ranging from approximately 10^6 to 10^8) - This serves as the legend.
### Detailed Analysis or Content Details
**Left Chart:**
* **708M (Yellow):** The line starts at approximately Loss = 4.2 with Tokens = 10^7 and decreases rapidly to approximately Loss = 2.6 with Tokens = 10^10.
* **302M (Green):** The line starts at approximately Loss = 4.0 with Tokens = 10^7 and decreases to approximately Loss = 3.0 with Tokens = 10^10.
* **85M (Light Blue):** The line starts at approximately Loss = 4.1 with Tokens = 10^7 and decreases to approximately Loss = 3.4 with Tokens = 10^10.
* **3M (Dark Blue):** The line starts at approximately Loss = 4.3 with Tokens = 10^7 and decreases to approximately Loss = 3.8 with Tokens = 10^10.
* **25M (Orange):** The line starts at approximately Loss = 4.1 with Tokens = 10^7 and decreases to approximately Loss = 3.2 with Tokens = 10^10.
* **393.2K (Purple):** The line starts at approximately Loss = 4.3 with Tokens = 10^7 and remains relatively flat, ending at approximately Loss = 4.2 with Tokens = 10^10.
**Right Chart:**
The chart displays a heatmap-like representation of loss as a function of estimated S_min and model parameters. The color intensity corresponds to the number of parameters.
* **General Trend:** For all parameter sizes, the loss generally decreases as S_min increases.
* **Parameter Impact:** Higher parameter counts (yellow/orange) generally exhibit lower loss values for a given S_min compared to lower parameter counts (blue/purple).
* **Specific Observations:**
* The highest parameter models (yellow) show the most significant loss reduction with increasing S_min, reaching a loss of approximately 2.4 at S_min = 10^5.
* The lowest parameter models (purple) show a less pronounced loss reduction, remaining around a loss of 3.8-4.0 even at S_min = 10^5.
### Key Observations
* In the left chart, increasing the dataset size consistently reduces loss across all model sizes.
* Larger models (708M, 302M) consistently achieve lower loss values than smaller models (3M, 393.2K) for a given dataset size.
* The right chart confirms that increasing training steps (S_min) reduces loss, and this effect is more pronounced for larger models.
* The 393.2K model shows minimal improvement with increased dataset size in the left chart, suggesting it may be underparameterized.
### Interpretation
The data strongly suggests that both model size and dataset size are critical factors in achieving low loss. Increasing either of these factors leads to improved performance. The right chart reinforces this by showing that increased training (S_min) also contributes to lower loss, particularly for larger models. The consistent trend of decreasing loss with increasing parameters and dataset size indicates a clear scaling relationship. The relatively flat curve for the 393.2K model in the left chart suggests that this model has reached its capacity and cannot benefit further from increased data. This highlights the importance of model capacity in effectively utilizing larger datasets. The colorbar on the right chart provides a continuous representation of parameter size, allowing for a more nuanced understanding of the relationship between model size, training steps, and loss. The logarithmic scales on both axes are appropriate for visualizing the wide range of values involved.