## Line Charts: Performance Metrics (Hit@1 and F1) vs. Depth and Width on WebQSP and CWQ Datasets
### Overview
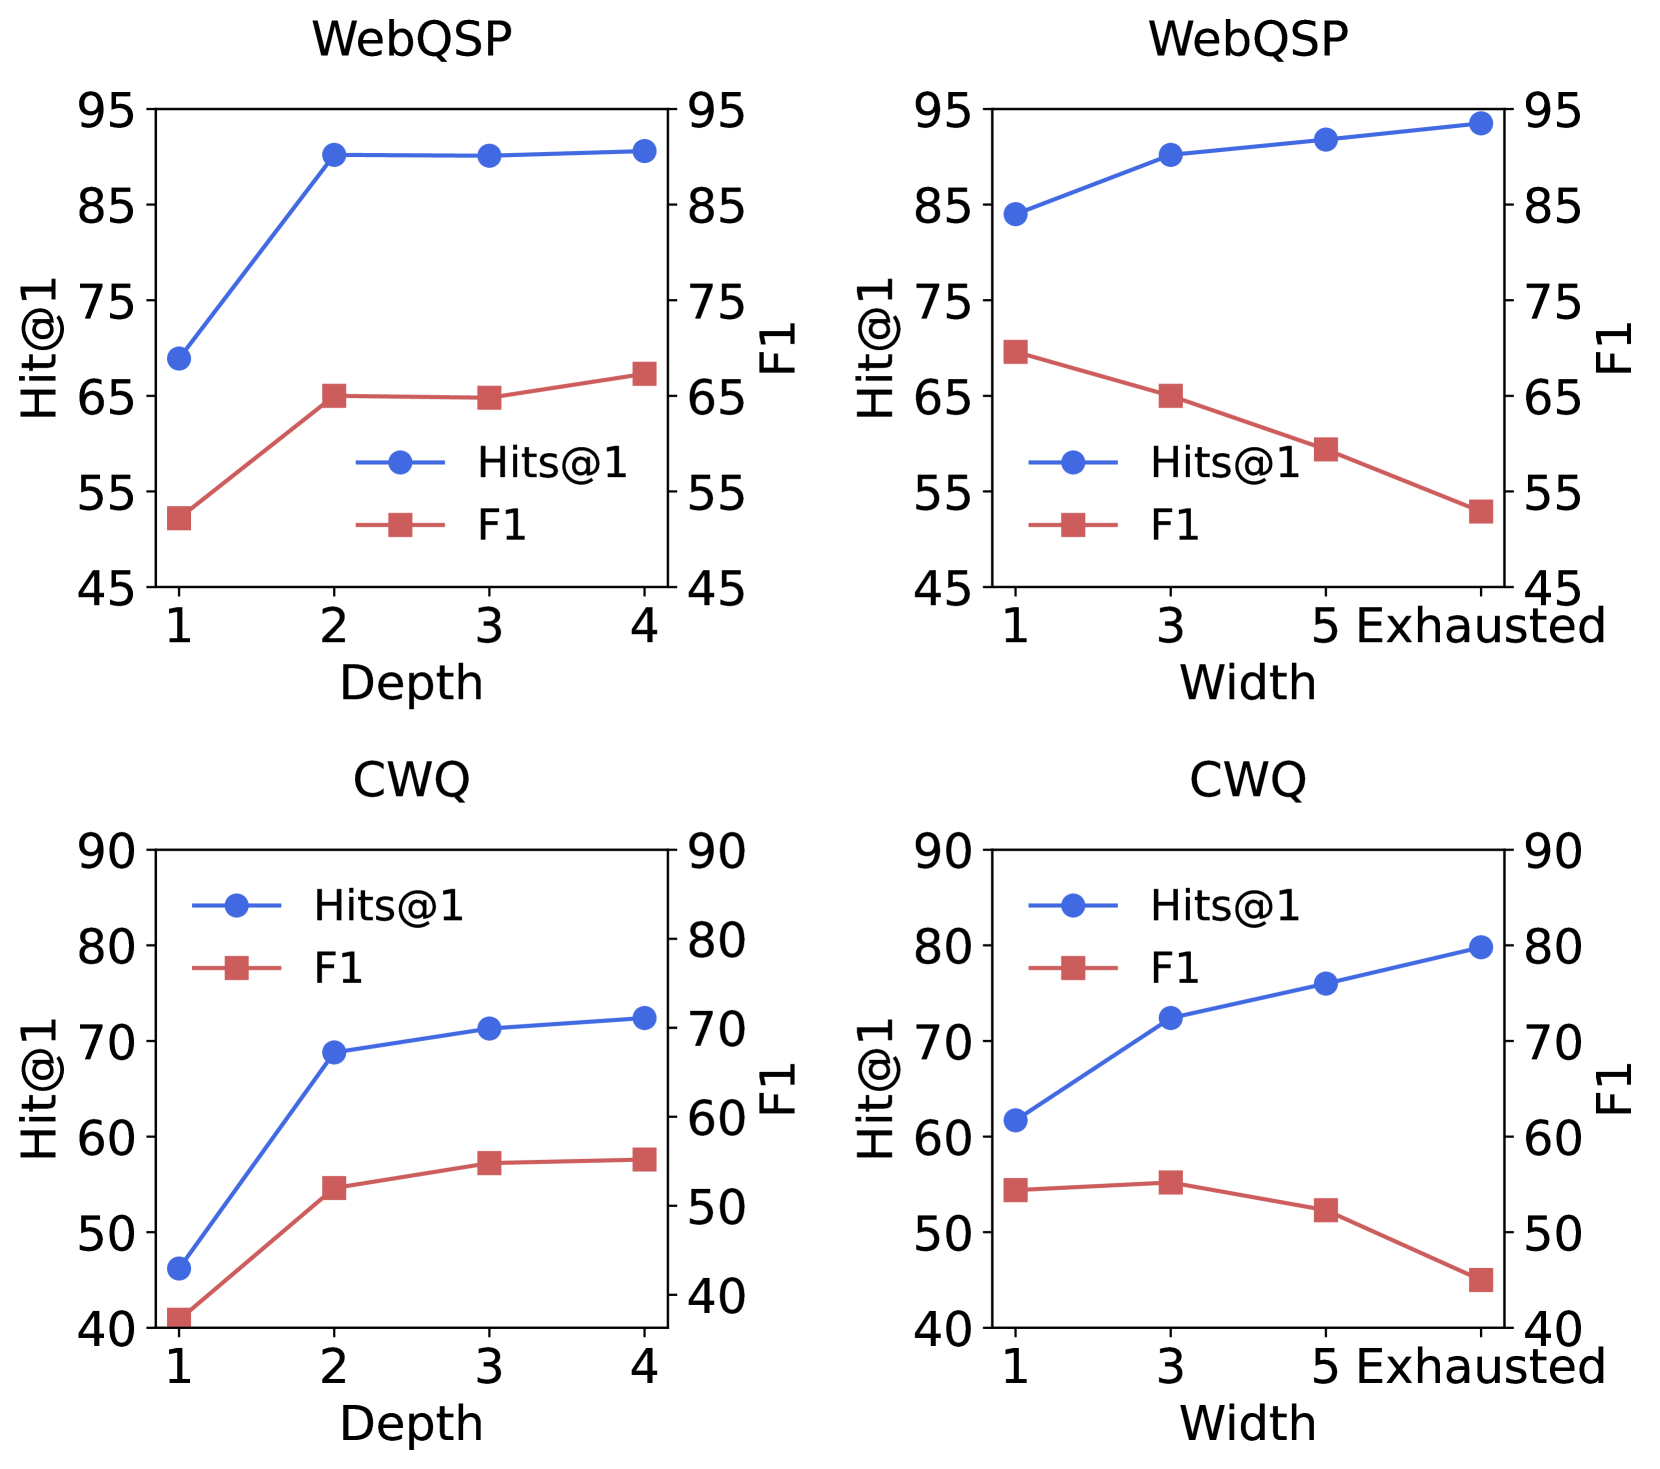
The image contains four line charts arranged in a 2x2 grid. The charts display the performance of a system (likely a question-answering or retrieval model) on two datasets, **WebQSP** (top row) and **CWQ** (bottom row). Performance is measured by two metrics: **Hit@1** (blue line with circle markers) and **F1** (red line with square markers). The charts explore how these metrics change with two different parameters: **Depth** (left column) and **Width** (right column).
### Components/Axes
* **Titles:** Each chart has a title indicating the dataset: "WebQSP" (top-left, top-right) and "CWQ" (bottom-left, bottom-right).
* **Y-Axes (Dual Axis):**
* **Left Y-Axis:** Labeled "Hit@1". Scale ranges vary slightly per chart (e.g., 45-95 for WebQSP, 40-90 for CWQ).
* **Right Y-Axis:** Labeled "F1". Scale ranges are identical to the left axis for each respective chart.
* **X-Axes:**
* **Left Column Charts:** Labeled "Depth". Categories are discrete integers: 1, 2, 3, 4.
* **Right Column Charts:** Labeled "Width". Categories are: 1, 3, 5, and "Exhausted".
* **Legend:** Present in all charts. Contains two entries:
* Blue line with circle marker: "Hits@1" (Note: Label uses "Hits@1" while axis uses "Hit@1").
* Red line with square marker: "F1".
* **Legend Placement:** In the top-left and bottom-left charts, the legend is placed inside the plot area, roughly in the center-right region. In the top-right and bottom-right charts, the legend is placed in the top-left corner of the plot area.
### Detailed Analysis
#### **Chart 1: WebQSP vs. Depth (Top-Left)**
* **Trend Verification:**
* **Hit@1 (Blue):** Shows a sharp increase from Depth=1 to Depth=2, then plateaus.
* **F1 (Red):** Shows a moderate increase from Depth=1 to Depth=2, then plateaus with a slight upward trend.
* **Data Points (Approximate):**
* Depth=1: Hit@1 ≈ 69, F1 ≈ 52
* Depth=2: Hit@1 ≈ 90, F1 ≈ 65
* Depth=3: Hit@1 ≈ 90, F1 ≈ 65
* Depth=4: Hit@1 ≈ 91, F1 ≈ 67
#### **Chart 2: WebQSP vs. Width (Top-Right)**
* **Trend Verification:**
* **Hit@1 (Blue):** Shows a steady, gradual increase as Width increases.
* **F1 (Red):** Shows a steady, gradual decrease as Width increases.
* **Data Points (Approximate):**
* Width=1: Hit@1 ≈ 84, F1 ≈ 70
* Width=3: Hit@1 ≈ 90, F1 ≈ 65
* Width=5: Hit@1 ≈ 92, F1 ≈ 60
* Width=Exhausted: Hit@1 ≈ 94, F1 ≈ 53
#### **Chart 3: CWQ vs. Depth (Bottom-Left)**
* **Trend Verification:**
* **Hit@1 (Blue):** Shows a sharp increase from Depth=1 to Depth=2, then a slower, steady increase.
* **F1 (Red):** Shows a sharp increase from Depth=1 to Depth=2, then a slower, steady increase.
* **Data Points (Approximate):**
* Depth=1: Hit@1 ≈ 46, F1 ≈ 41
* Depth=2: Hit@1 ≈ 69, F1 ≈ 54
* Depth=3: Hit@1 ≈ 71, F1 ≈ 57
* Depth=4: Hit@1 ≈ 72, F1 ≈ 57
#### **Chart 4: CWQ vs. Width (Bottom-Right)**
* **Trend Verification:**
* **Hit@1 (Blue):** Shows a steady, gradual increase as Width increases.
* **F1 (Red):** Shows a slight initial plateau/increase from Width=1 to Width=3, followed by a steady decrease.
* **Data Points (Approximate):**
* Width=1: Hit@1 ≈ 62, F1 ≈ 54
* Width=3: Hit@1 ≈ 72, F1 ≈ 55
* Width=5: Hit@1 ≈ 76, F1 ≈ 52
* Width=Exhausted: Hit@1 ≈ 80, F1 ≈ 45
### Key Observations
1. **Depth vs. Width Trade-off:** Increasing **Depth** improves both Hit@1 and F1 metrics on both datasets, with the most significant gain occurring between depth 1 and 2. Increasing **Width** consistently improves Hit@1 but leads to a decline in F1, especially at higher widths.
2. **Dataset Comparison:** The system achieves higher absolute performance scores on the **WebQSP** dataset compared to the **CWQ** dataset across all conditions. The general trends, however, are consistent between the two datasets.
3. **"Exhausted" Width:** The "Exhausted" width condition yields the highest Hit@1 score in both WebQSP (~94) and CWQ (~80), but also the lowest or near-lowest F1 score for each respective dataset (WebQSP: ~53, CWQ: ~45).
4. **Metric Divergence with Width:** The gap between the Hit@1 and F1 lines widens as Width increases, indicating the two metrics are responding oppositely to this parameter.
### Interpretation
The data suggests a fundamental trade-off in the system's behavior when expanding search **width** versus **depth**.
* **Depth appears to enhance quality and precision.** Increasing the depth of search (perhaps the number of reasoning steps or hops in a knowledge graph) allows the system to find more correct top answers (higher Hit@1) while also improving the overall precision/recall balance (higher F1). The plateau after depth 2 suggests diminishing returns.
* **Width appears to enhance recall at the cost of precision.** Increasing the width (perhaps the number of parallel paths or candidates considered) makes it more likely the correct answer is found somewhere in the results (higher Hit@1). However, it also introduces more noise or incorrect candidates, which degrades the F1 score, which balances precision and recall. The "Exhausted" state represents the extreme of this strategy: maximizing the chance of finding the answer but with significant collateral noise.
Therefore, the choice between increasing depth or width depends on the application's priority. If finding the single best answer (Hit@1) is paramount and some noise is acceptable, a wider search is beneficial. If the overall quality and correctness of the answer set (F1) are critical, a deeper, more focused search is preferable. The consistent trends across two different datasets (WebQSP and CWQ) indicate this is a robust characteristic of the evaluated system.