## Flowchart: System State Transitions Over Time
### Overview
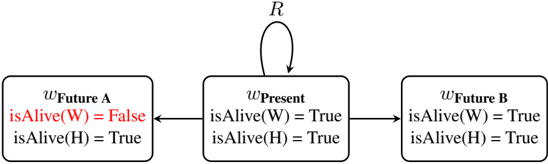
The diagram illustrates a three-state system transition model with temporal states (Future A, Present, Future B) and binary conditions for two entities (W and H). Arrows indicate directional flow between states, with a self-loop in the Present state.
### Components/Axes
- **States**:
- `wFuture A`: Initial state with `isAlive(W) = False`, `isAlive(H) = True`
- `wPresent`: Intermediate state with `isAlive(W) = True`, `isAlive(H) = True`
- `wFuture B`: Final state with `isAlive(W) = True`, `isAlive(H) = True`
- **Transitions**:
- Linear flow: `wFuture A` → `wPresent` → `wFuture B`
- Self-loop: `wPresent` → `wPresent` (recurrent state)
- **Conditions**:
- Binary status indicators for entities W and H (`isAlive` = True/False)
### Detailed Analysis
1. **wFuture A**:
- `isAlive(W) = False` (marked in red, indicating critical status)
- `isAlive(H) = True` (stable condition)
- Positioned at the leftmost node, serving as the starting point.
2. **wPresent**:
- Both entities alive (`isAlive(W) = True`, `isAlive(H) = True`)
- Central node with bidirectional flow:
- Incoming from `wFuture A`
- Outgoing to `wFuture B`
- Self-loop (recurrent state)
- Positioned centrally, acting as a transitional hub.
3. **wFuture B**:
- Both entities alive (`isAlive(W) = True`, `isAlive(H) = True`)
- Final state on the right, receiving flow from `wPresent`.
### Key Observations
- **Temporal Progression**: The system evolves from a degraded state (`wFuture A`) to a stable state (`wPresent`), then to a fully restored state (`wFuture B`).
- **Critical Transition**: The red marking of `isAlive(W) = False` in `wFuture A` highlights a failure state for entity W, resolved in subsequent states.
- **Stability in Present**: The self-loop in `wPresent` suggests a metastable equilibrium where both entities remain alive.
- **Recovery Pattern**: Entity W's status transitions from `False` (Future A) → `True` (Present) → `True` (Future B), indicating irreversible recovery.
### Interpretation
This diagram models a fault-tolerant system with temporal recovery mechanisms:
1. **Failure State (`wFuture A`)**: Entity W fails while H remains operational, representing a partial system degradation.
2. **Recovery Phase (`wPresent`)**: Both entities achieve operational status, with the self-loop suggesting active maintenance or stabilization processes.
3. **Optimal State (`wFuture B`)**: Full system functionality restored, with no recurrence of failure states.
The recurrent arrow from `wPresent` to itself implies that the system may remain in a stable intermediate state indefinitely before progressing to the final state. The absence of alternative failure paths suggests deterministic recovery once the Present state is reached. This could represent a computational process, biological lifecycle, or engineering system with built-in redundancy.