## Line Graph: Musical MLM Loss vs Training Steps
### Overview
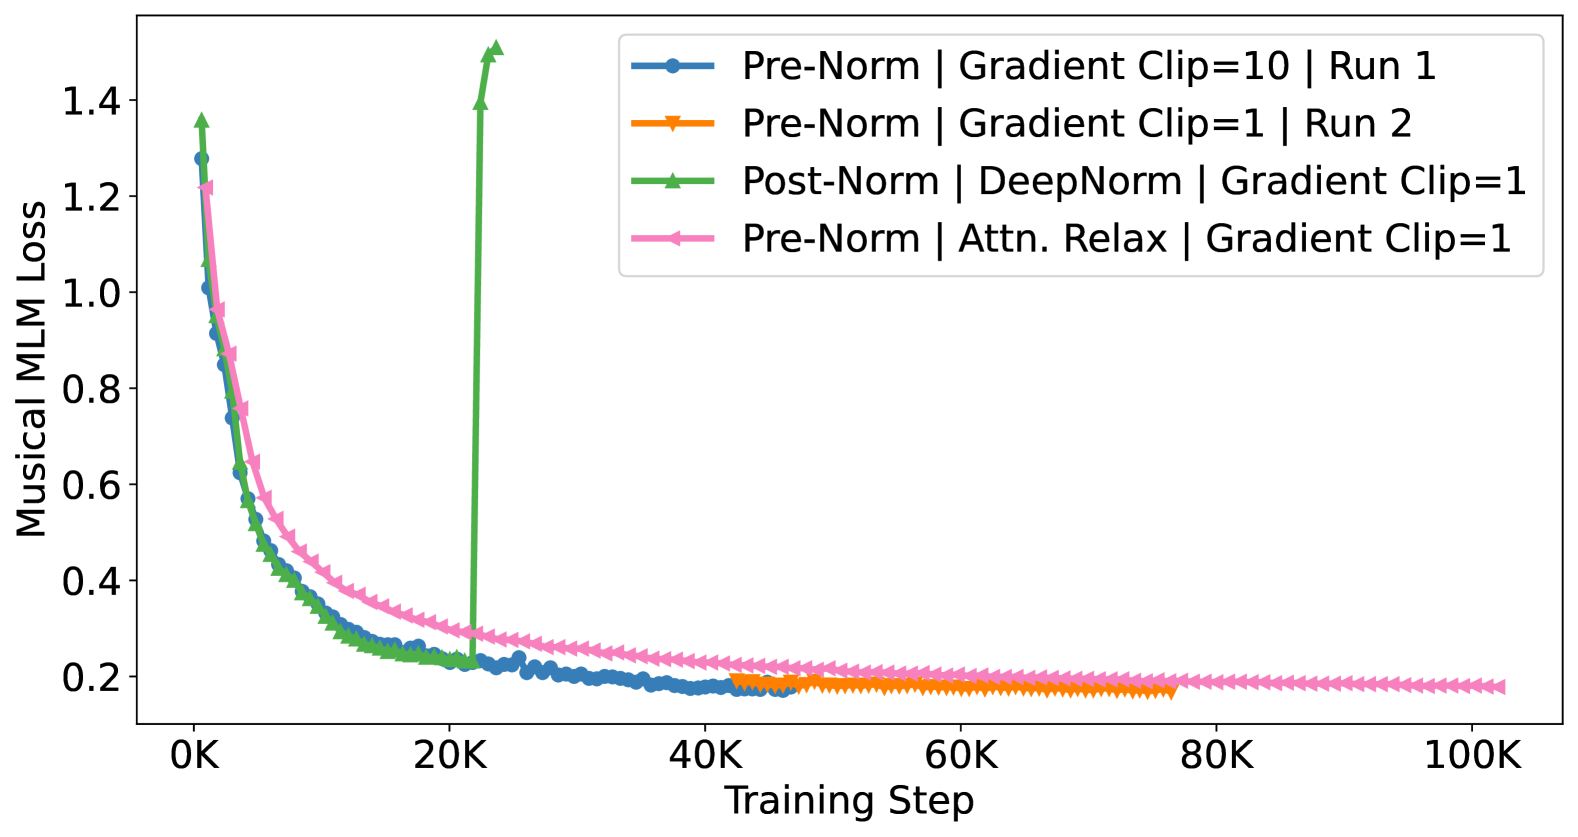
The graph compares the convergence behavior of four different model configurations during training, tracking the reduction in Musical MLM Loss over 100,000 training steps. All lines show decreasing loss trends, but with distinct patterns and anomalies.
### Components/Axes
- **X-axis**: Training Step (0K to 100K, logarithmic scale)
- **Y-axis**: Musical MLM Loss (0.2 to 1.4)
- **Legend**: Located in top-right corner with four entries:
1. Blue circles: Pre-Norm | Gradient Clip=10 | Run 1
2. Orange triangles: Pre-Norm | Gradient Clip=1 | Run 2
3. Green triangles: Post-Norm | DeepNorm | Gradient Clip=1
4. Pink triangles: Pre-Norm | Attn. Relax | Gradient Clip=1
### Detailed Analysis
1. **Blue Line (Gradient Clip=10)**:
- Starts at ~1.3 loss at 0K
- Sharp decline to ~0.2 by 20K
- Plateaus with minor fluctuations
- Final loss: ~0.18 at 100K
2. **Orange Line (Gradient Clip=1)**:
- Begins at ~1.2 loss at 0K
- Steep drop to ~0.2 by 20K
- Slight upward trend (0.21-0.23) between 40K-60K
- Stabilizes at ~0.2 by 100K
3. **Green Line (Post-Norm)**:
- Starts at ~1.35 loss at 0K
- Sharp decline to ~0.2 by 20K
- **Anomaly**: Sudden spike to ~1.4 at 25K
- Rapid drop back to ~0.2 by 30K
- Final loss: ~0.2 at 100K
4. **Pink Line (Attn. Relax)**:
- Begins at ~1.25 loss at 0K
- Gradual decline to ~0.25 by 40K
- Steady plateau at ~0.22-0.24 from 60K-100K
### Key Observations
- **Gradient Clipping Impact**: Higher clipping (10 vs 1) enables faster initial convergence (blue vs orange lines)
- **Post-Norm Anomaly**: Green line shows critical instability at 25K (1.4 loss spike)
- **Attention Relaxation**: Pink line demonstrates slowest convergence but most stable late-stage performance
- **Run Variance**: Orange line (Run 2) shows unexpected mid-training fluctuation absent in Run 1
### Interpretation
The data suggests:
1. **Gradient Clipping Tradeoffs**: Higher clipping (10) enables faster early convergence but may risk instability, while lower clipping (1) provides more stable but slower training.
2. **Normalization Sensitivity**: The Post-Norm configuration (green line) exhibits catastrophic failure at 25K, indicating potential incompatibility with the training dynamics or hyperparameters.
3. **Attention Mechanism Robustness**: The Attn. Relax method (pink line) shows the most consistent performance despite slower convergence, suggesting better generalization properties.
4. **Run-Specific Variance**: The orange line's mid-training fluctuation (40K-60K) highlights potential sensitivity to initialization or stochastic factors in Run 2.
The anomaly in the Post-Norm configuration warrants further investigation into gradient explosion risks or architectural mismatches. The attention relaxation method's stability despite slower convergence suggests it may be preferable for production systems prioritizing reliability over speed.